
About My Subscription Service
Welcome to ETFadviser’s about me page 👋
- 1️⃣Why Subscribe
- 2️⃣Frequently Asked Questions
- 3️⃣How I Think About Investing
Scroll down to view the relevant sections below:

A weekly research service built on the core-satellite framework:
- Your core portfolio tracks the global market through diversified ETFs like VDHG or DHHF — set and forget. We rank and review every major core ETF so you always know which one suits you best.
- Your satellite portfolio is where the real opportunities are. Gold, energy, commodities, healthcare, defence — sectors and themes that core ETFs underweight or miss entirely. We run a real-money Best Ideas satellite portfolio and share every position, every trade, and the reasoning behind it.
We do the research so you don’t have to.
🎯New to ETFs? 🎯
Read our free guide: How to Build a Winning ETF Portfolio from Scratch

What you get as a paid subscriber:
- 90+ page Weekly ETF Intelligence Report covering 13 ASX ETF asset classes
- Best Ideas Model Portfolio — +9.76% return while the ASX 200 fell 3.2% (Sharesight verified)
- Mid-Week Market Check-In & Portfolio Review — exclusive Wednesday video for subscribers
- Intra-week trade alerts when conditions shift
- Market Health-o-Meter signal — our proprietary green/orange/red system that told subscribers to go defensive in February, before the March sell-off
Who is this for?
Self-directed investors and SMSF trustees who want institutional-grade ETF research without the institutional price tag.
Where can you find more?
If you want to learn more about my investment process, you can visit my website
Also make sure to watch my weekly market updates on YouTube
When you are ready, we would love for you to subscribe for our service:
If you are having issues with Substack’s payment options, you can also subscribe for 12 months, with a 20% discount via Paypal here ($384):

Get full access to this week’s 90+ page report, the model portfolio, and the mid-week video. Cancel anytime — no forms, no commitment.
Start Your Free Trial

Here are our FAQs so far: ⤵️
- I Just Signed Up: How Should I Get Started?
- How Much to Allocate Between Core & Satellite?
- What Investments Work for a Core Portfolio and Why?
- Do I Buy The Best Ideas Satellite Portfolio Today, or Wait for Buy Points?
- What is the Income Model Portfolio?
- Stop Losses Explained
- Portfolio Turnover
- How to Enter a Trade
- How Will I Be Notified of New Model Portfolio Trades?
- What chart package do you use and what moving averages and why?

Put simply, take your time. The best investors are patient investors.
Welcome aboard! 🤝
Thank you for becoming a paid subscriber—your support means a lot and helps fuel this independent research service. With over 20 years in markets (plus thousands of hours studying the world’s best investors), I’ve distilled actionable insights into ASX-listed ETFs, big global themes, and a disciplined core-satellite process that’s often missing in the Australian space.
Investing is a long-term journey, not a sprint. Many concepts here—especially the global macro lens and thematic satellite ideas—may feel new at first. That’s okay. Take your time to absorb, learn, and apply them gradually. The rewards come from consistent process and patience, not rushing in.
Here’s my recommended starting path for new members:
- Watch the latest Weekly Update on YouTube Head to the ETFadviser YouTube channel (@ETFadviser) and watch the most recent Australian Weekly ETF Review. It gives you a real-time feel for how I’m viewing markets, key themes, and the ETFs we’re tracking. This is the best way to quickly get oriented.
- If you’re on an annual subscription, book your complimentary 20-minute intro call Reach out to info@etfadviser.com.au with a brief overview of your situation (e.g., experience level, portfolio goals). We’ll schedule a quick chat to answer questions and help you tailor the core-satellite approach to your needs.
- Engage via Substack Chat anytime Feel free to message me directly in the Substack chat—I’m responsive and genuinely enjoy hearing from members (new and long-term alike). No question is too basic. Your input often sparks ideas for future updates, research notes, or even additions to the FAQs. Interaction helps everyone learn.
Quick tips for your first few weeks/months✅
- Start conservatively: Focus on the weekly updates and alerts first. Build comfort before allocating heavily to satellite ideas.
- Review the FAQs: Especially sections on core vs. satellite allocation, buy points, and stop losses—they’re designed to guide your onboarding.
- Be patient: Full investment in the Best Ideas Satellite Portfolio often takes 3–6 months. Use this time to learn the process; you’ll emerge a stronger, more confident investor.

Allocation depends on your portfolio objectives, risk tolerance, time horizon, and investing experience.
Q: What is the core-satellite approach, and why use it?
A: It combines stability with targeted upside — the best of both worlds for long-term investing.
- Core (the foundation): Low-cost, diversified, passive holdings (e.g., broad-market ASX-listed ETFs tracking global equities, bonds, or balanced indices). These keep expenses down, reduce overall volatility, and capture reliable long-term market growth.
- Satellite (the enhancer): Smaller, higher-conviction allocations to our key ideas and themes, aiming for outperformance through targeted opportunities — without risking the stability of your entire portfolio.
This balanced structure keeps you aligned with broad market returns while adding potential alpha from selective, active ideas.
Q: How should I divide my portfolio between core and satellite?
A: Base the split on your experience, risk tolerance, and goals:
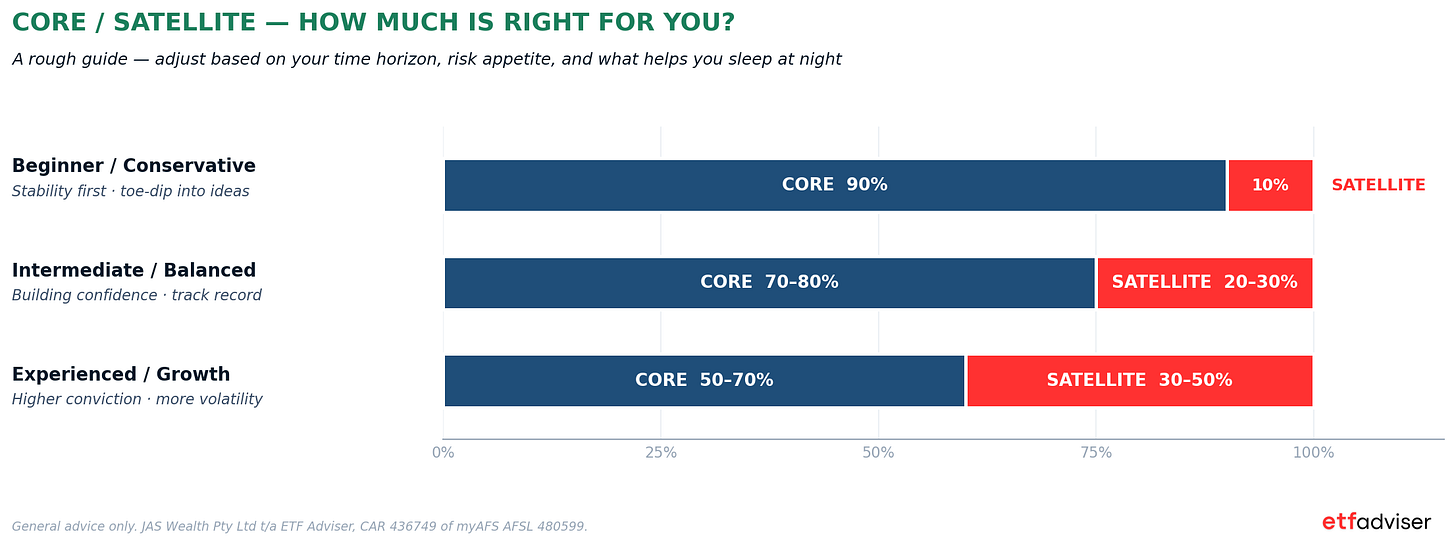
- Beginners or conservative investors: Start with 90% core / 10% satellite. This prioritizes stability and learning while giving you a small toe-dip into higher-conviction ideas.
- Intermediate / balanced investors: Move toward 70–80% core / 20–30% satellite as your confidence grows and you build a track record.
- Experienced / growth-oriented investors: Consider 50–70% core / 30–50% satellite if you’re comfortable with more volatility for greater upside potential.
KEY RULE: Only increase satellite exposure gradually, guided by multi-year performance — not short-term wins or losses. Patience here protects against overconfidence during hot streaks.
Q: How do you handle the core in practice?
A: Core is “set and forget.” We treat these holdings as long-term anchors. We only suggest raising cash in anticipation of major market corrections — otherwise, stay invested to let compounding do its work.
Q: Where does the real edge come from in this setup?
A: Satellites are where our edge shines. Our trade alerts and key ideas are designed specifically for the satellite portion — focused, thematic, and higher-conviction opportunities suited to active management.
Q: Not every idea wins — how do you manage that?
A: Success is probabilistic. Not every satellite idea will outperform, but disciplined execution helps the sleeve beat the broader market over time: quick cuts on losers (via stop losses — see the relevant section below), letting winners run, and consistent process. The framework is flexible — tailor it to your life stage and goals.
Q: I’m just starting with you — where should I begin?
A: Start conservatively (e.g., 80–90% core) and let the process unfold. Follow the weekly updates and alerts, learn our timing principles, and gradually build satellite exposure as you gain comfort. This disciplined core-satellite approach has proven effective for self-directed investors seeking reliable growth and targeted upside over the long haul.

We cover core investments in section 3 of our weekly ETF update:
Q: What exactly is the “core” of a portfolio, and why does it matter?
A: At the heart of every successful long-term portfolio is a solid core — the stable, diversified base that captures reliable market growth, keeps costs low, and reduces overall volatility. Think of it as the equivalent of what you’d find in a typical public-offer superannuation fund: you choose an allocation ranging from conservative to high growth, and it does the heavy lifting over time.
Q: How do you approach core holdings in your models?
A: We treat core holdings as “set-and-forget” anchors: low-maintenance, broadly diversified ASX-listed ETFs that form the bedrock of your investments. These are only adjusted in anticipation of major market corrections — never for short-term noise or headlines.
Q: What’s the big advantage of using ASX-listed ETFs for the core?
A: They deliver the same broad exposures — often across thousands of underlying holdings — but at much lower costs thanks to passive index-tracking. No need to rely on active managers, who frequently underperform their benchmarks over time (especially after fees).
Studies like the SPIVA reports consistently show this: for example, in the SPIVA Australia Mid-Year 2025, around 71% of Australian Equity General funds underperformed the ASX 200 in H1 2025, and over longer periods (e.g., 15 years), up to 85%+ of active funds lag in many categories. Passive strategies capture market returns efficiently, minimize costs, and let compounding work uninterrupted.
Q: Why go passive for the core specifically?
A: Because the data backs it up. The majority of active fund managers fail to beat their index after fees, particularly over longer horizons. By choosing index-based diversified ETFs, you avoid that drag and stay focused on reliable, broad-market exposure. (Check the latest SPIVA Australia Mid-Year 2025 for the full details — it reinforces why passive wins in broad markets.)
Q: What are the recommended core options on the ASX?
A: Pick just one of these diversified ETFs for your core — each provides instant diversification across equities, bonds, and geographies.
A single ETF can hold thousands of individual investments (e.g., VDGR holds over 16,000 underlying holdings)..
⬆️ More Aggressive
- GHHF - 100% growth assets + 30-40% leverage
- DHHF - 100% growth assets
- VDAL - 100% growth assets
- VDHG - 90% growth assets, 10% defensive assets
- IGRO - 90% growth assets, 10% defensive assets
- DZZF - 90% growth assets, 10% defensive assets
- VGRO - 80% growth assets, 20% defensive assets
- GROW - up to 75% growth assets, up to 25% defensive assets (more active)
- VDGR - 70% growth assets, 30% defensive assets
- DGGF - 70% growth assets, 30% defensive assets
- VDIF - 60% growth assets, 40% defensive assets
- VBAL - 60% growth assets, 40% defensive assets
- VDBA - 50% growth assets, 50% defensive assets
- IBAL - 50% growth assets, 50% defensive assets
- DBBF - 50% growth assets, 50% defensive assets
- VDCO - 30% growth assets, 70% defensive assets
⬇️More conservative
Q: How should I implement or choose my core?
A:
- One ETF is usually enough — it simplifies everything while delivering true diversification.
- Tailor to your risk tolerance and life stage: Aggressive/growth-focused investors lean toward DHHF or VDAL; balanced or income seekers prefer VDBA, VDIF, or VDCO.
- Build your core first (especially if you’re newer to investing), then layer in satellites for higher-conviction themes.
- Currency and hedging: Most have some unhedged international exposure — monitor AUD movements and consider hedged alternatives if volatility concerns you.
- For income-oriented cores, check distributions from options like VDIF or DGGF.
Q: What’s the bottom line on the core?
A: The core isn’t about excitement — it’s about reliability. Stay invested, keep costs low, protect what you have, and let the satellite sleeve hunt for outperformance. This disciplined core-satellite approach has proven effective for self-directed investors seeking to build and compound wealth over the long haul.

I get it—you’re excited to dive in and replicate the Best Ideas Satellite Portfolio right away. However, I strongly recommend taking your time to build positions thoughtfully.
Q: I’m excited to join—should I jump in and buy the full Best Ideas Satellite Portfolio right away?
A: I get the enthusiasm—it’s great to see! But I strongly recommend taking your time to build positions thoughtfully rather than front-loading everything at once. Patience here pays off big in the long run.
Q: Why not go all-in immediately?
A: Themes and satellite ideas move in phases. The strongest, most rewarding part (the “meat”) of a trend, sector, or theme often lasts just a few months. We add new high-conviction ideas regularly through alerts and updates, so there’s no need to rush and buy everything today. Building gradually lets you capture the best entry points as they appear.
A real example: a 40% move in XMET from the buy point in 1.5 months:
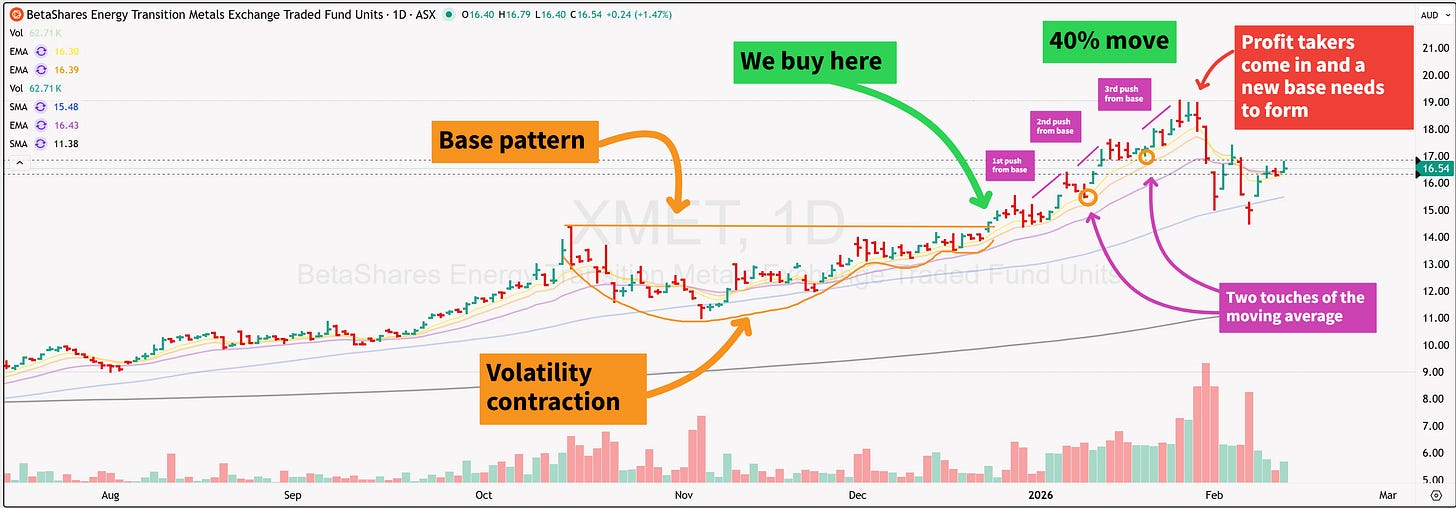
We took partial profits near highs, and we waited with the rest of the position for XMET to form a new base:

Q: How do I know when and how much to buy?
A: Follow the trade alerts. Whenever we enter, adjust, or exit a position, you’ll get a clear alert with the rationale and levels we consider optimal. This lets you replicate trades in near real-time at the points we view as strongest for risk/reward.
Q: Why do buy points matter so much?
A: Entering from a defined “key buy point” (e.g., a technical setup, meaningful pullback, or breakout) gives you the best starting risk/reward. It allows tighter stop losses to limit downside while giving winners plenty of room to run—maximizing your edge on each idea. (See our stop-loss guidelines section below for the full principles.)
Q: How long does it usually take to get fully invested in the satellite portfolio?
A: From joining as a member to being fully invested typically takes 3–6 months—and that’s by design. Use this period as a hands-on learning opportunity. You’ll gain deeper insight into timing, discipline, and our process, emerging as a stronger, more confident investor overall.
Q: What if I spot a great theme in the weekly updates that isn’t in the official satellite portfolio yet?
A: I don’t claim to catch every winner—sometimes a compelling idea shows up in updates but doesn’t make the formal model right away. If something resonates strongly with you, consider it on its own merits... just apply a disciplined stop loss and sizing rules (see the relevant section below). Portfolio management is part art, part science—we’re here to guide and educate, not dictate every move.
Q: Bottom line—what’s the best approach for new members?
A: We all crave immediate results, but sustainable outperformance comes from process, not impulse. By following alerts, respecting buy points, and letting principles honed over 20+ years in markets guide you, you’ll position yourself for better long-term results with far less stress.
If you’re just starting, focus first on getting comfortable with the weekly updates and alerts—your satellite allocation will build naturally from there.

I cover off an income ETFs in section 4 of the weekly report:

Q: Why do so many Aussies focus heavily on income, and is that a problem?
A: Aussies love income — often to their detriment. Many chase the highest-yielding options without looking at the full picture, ending up with portfolios heavily tilted toward mature, slow-growing sectors like banks and resources. These can lag badly in strong bull markets or get hit hard during downturns when growth stocks shine.
Q: What’s the smarter way to think about income in a portfolio?
A: Always prioritize total return first and foremost — that’s the combination of capital growth and income. Treat an income tilt as a “nice-to-have” enhancement, but only if it doesn’t sacrifice long-term performance. High yields can come with real costs: lower overall growth, higher volatility, dividend traps, or missing out on faster-growing opportunities in global markets.
Q: Are there good income-oriented ETFs on the ASX if I still want some yield?
A: Yes — there’s a solid range of income-focused ETFs listed on the ASX, from diversified multi-asset options (e.g., blending high-dividend equities with bonds) to high-yield Australian equity plays (often with franking credits). The key is choosing ones that balance sustainable yield with diversification and reasonable costs, rather than just chasing the highest headline yield.
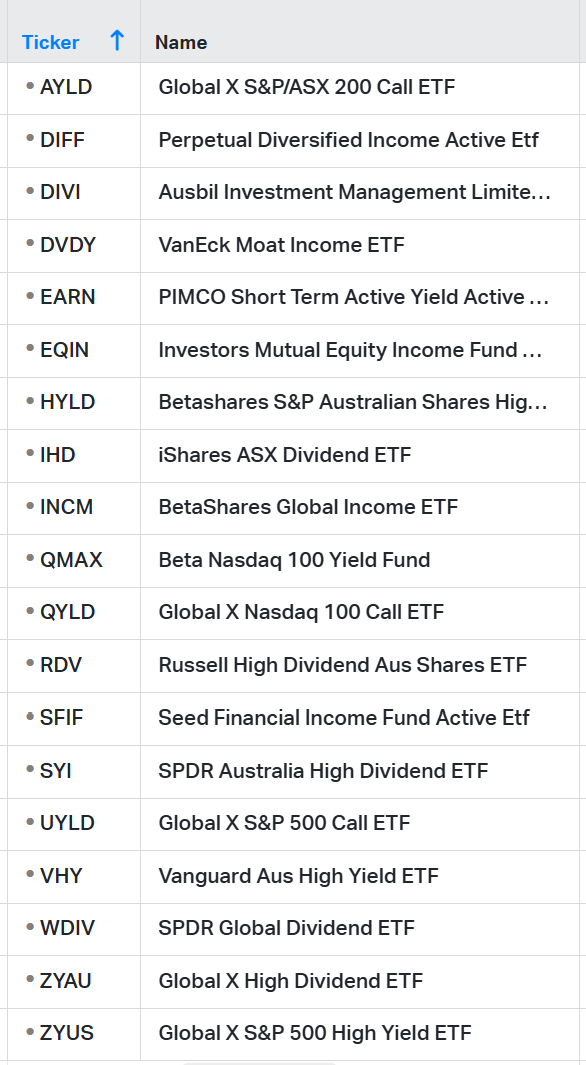
Q: Do you have a specific recommendation or model for income-focused investing?
A: Absolutely. I’ve built a practical income model portfolio as a ready-to-reference guide — it shows exactly how I would construct an income-oriented portfolio today. It aims for sustainable yield, broad diversification, low costs, and some growth potential, while deliberately avoiding common traps like over-concentration or pure yield-chasing.
Q: How should I use this income model in my overall portfolio?
A: You can incorporate it as part of your core allocation if your main objective is reliable cash flow (e.g., for retirement drawdowns or supplementing income). It really depends on your goals — for growth-focused investors, it might be a smaller tilt or complement to a more aggressive core. The flexibility is built in.
Q: What do subscribers get with the income model?
A: Full details: allocations, clear rationale, expected distributions (including franking credits where relevant), and ongoing updates in the weekly reviews. It’s designed to evolve with market conditions so you’re not left guessing.
Bottom line
Chasing yield alone rarely beats a disciplined focus on total return over time. Add income thoughtfully — as an enhancement, not the main driver — and you’ll be in a much stronger position to compound wealth sustainably.

Q: How tight should my stop losses be on satellite positions?
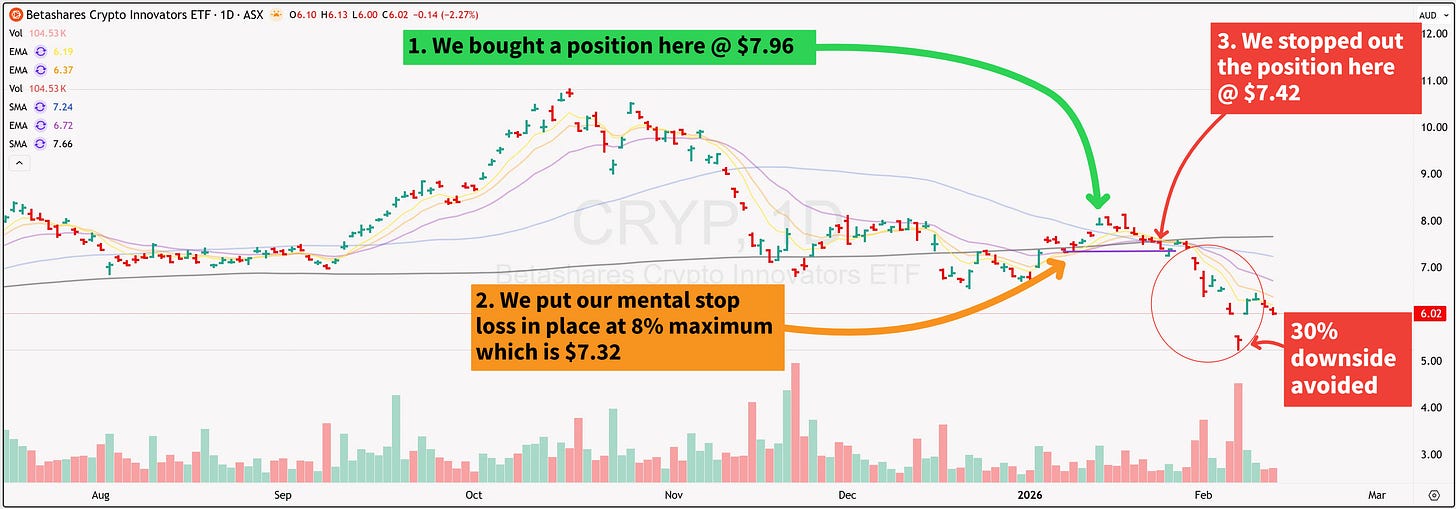
A: I recommend using stop losses of no more than 8% below a well-defined buy point to protect capital and preserve your ability to compound over time. The goal is to keep downside limited and quantifiable right from entry.
Q: Why is a good entry point so important for stop losses?
A: Proper entries reduce unnecessary stop-outs. When you enter from a strong buy point (as guided by our trade alerts), you should rarely get stopped out unless the underlying investment thesis has materially changed. A thoughtful entry sets up favorable risk/reward from the start — it gives your winners room to breathe while capping losses if you’re wrong.
Q: How do you feel about taking losses?
A: I’m completely comfortable taking multiple small losses — ideally in the 3–5% range. Cutting losers fast is essential. It frees up capital for the next high-conviction opportunity and lets winners run without interference. Small losses are simply the cost of doing business when hunting asymmetric upside in satellite ideas.
Q: Should I set hard stop-loss orders in my broker platform?
A: No — avoid rigid, fixed stop-loss orders for most ASX ETFs, especially thematic or lower-volume ones. These can experience sharp, erratic moves during the market open due to gaps, low liquidity, or order imbalances. A hard stop risks triggering at suboptimal prices far below your intended level. Instead, keep your mental stop-loss level clearly defined before entering, and exit manually if price hits it.
Q: What’s the most important part of executing stops?
A: Mental discipline. Always know your stop-loss level before you enter the trade. If price moves against you and reaches that level, exit decisively — no second-guessing, no hoping for a bounce. Live to fight another day. This discipline is what separates consistent performers from the crowd.
Q: How do you apply this in the model portfolios?
A: In the model portfolios, I only add positions where the downside is quantifiable and limited at entry. This allows us to be proven wrong quickly and cheaply if the thesis doesn’t hold. By rigorously controlling the downside through thoughtful entries and stops, the upside tends to take care of itself over time.
Here is an real example from the satellite model portfolio:

Q: Why do you emphasize protecting capital so much?
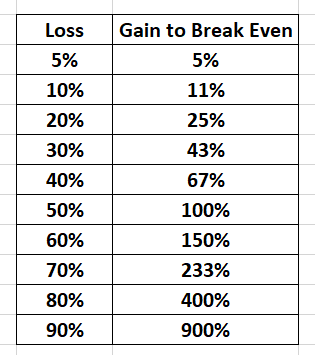
A: This approach has been battle-tested over 20+ years: protect what you have, and compounding does the heavy lifting. Losses and gains are not symmetric in percentage terms — a loss requires a much larger percentage gain to break even, and the gap grows exponentially as losses get bigger. Big losses destroy capital faster and make recovery exponentially harder (even with later winners). Small, frequent losses are far easier to absorb and don’t create this destructive compounding effect.
Q: What’s the single best thing an investor can do?
A: Learn to take stop losses automatically and without question. It’s the best thing you will ever do as an investor. Once you master that, everything else — sizing, timing, letting winners run — falls into place much more naturally

Q: How often do you trade in your model portfolios, and why isn’t turnover kept as low as possible?
A: We aim to strike a deliberate balance between minimizing unnecessary trades (to keep costs and complexity low) and maximizing performance through active thesis testing in the satellite portfolio. The core remains very low-turnover — set-and-forget diversified ETFs with minimal adjustments except during anticipated major corrections. Satellites, however, involve more frequent entries/exits to capitalize on high-conviction themes (AI, clean energy, robotics, etc.).
Q: Doesn’t higher turnover hurt returns due to costs and taxes?
A: Not significantly in our setup.
- Transaction costs are very low on the ASX for ETFs — many brokers offer flat fees around $5–$10 per trade (or even lower with frequent-trader platforms), and spreads are tight on liquid ASX ETFs. For the typical satellite position size, brokerage is negligible relative to potential alpha from a good trade.
- Taxation (CGT) isn’t a major drag here. Satellite ideas rarely last over 12 months — we cut losses quickly if the thesis fails and let winners run until conviction fades or targets are hit. The 50% CGT discount (for holdings >12 months) rarely applies to satellites, so we don’t optimize for it. We focus on after-tax total return over time, not forcing long holds just for a tax break.
Q: What’s the rationale for more active trading in satellites?
A: Trades let us rigorously test investment theses in real time. If you have an edge (e.g., early identification of megatrends, disciplined risk management, or better timing via our weekly reviews), the more high-quality opportunities you evaluate and act on, the better.
Think of it as rolling the dice with a positive expected value:
- Cut losses quickly (small position sizing + strict stops/exits).
- Let winners run (no arbitrary sell rules if momentum/thesis holds).
- The more rolls with an edge → higher probability of strong overall outcomes.
Fewer trades might feel “safer,” but it can mean missing asymmetric opportunities or holding losers too long out of inertia. We avoid overtrading — every satellite entry requires strong conviction — but we don’t artificially suppress activity when the market offers clear edges.
Q: How does this compare to a classic low-turnover strategy?
A: Pure buy-and-hold works brilliantly for the core (broad market compounding with minimal intervention). But for satellites, a too-passive approach limits upside from thematic rotations.
Our hybrid model combines the best of both: rock-solid core stability + opportunistic satellite alpha. Historical evidence shows that disciplined active strategies with quick loss-cutting and winner retention can outperform passive benchmarks — especially when transaction frictions are low, as they are today.
Q: Can you show me how many trades you did in 2025?
A: You can see all our satellite model trades for 2025 HERE
Bottom line
Portfolio turnover isn’t inherently good or bad — it’s about net benefit. We keep it low where it matters (core), higher where it adds value (satellites), and always disciplined.
Low costs + edge-focused trading + ruthless loss control = the path we believe maximizes long-term, after-tax returns for self-directed investors.

Q: What are buy points and stop loss areas, and how do they work?
A: Each week, I highlight high-conviction key ideas (themes, sectors, or specific ASX-listed ETFs) to watch for the week ahead.
For satellite positions especially, I define a key buy point — this is a specific, well-reasoned technical or fundamental level where the setup offers strong risk/reward.
You can learn more about the chart setups here
Example:
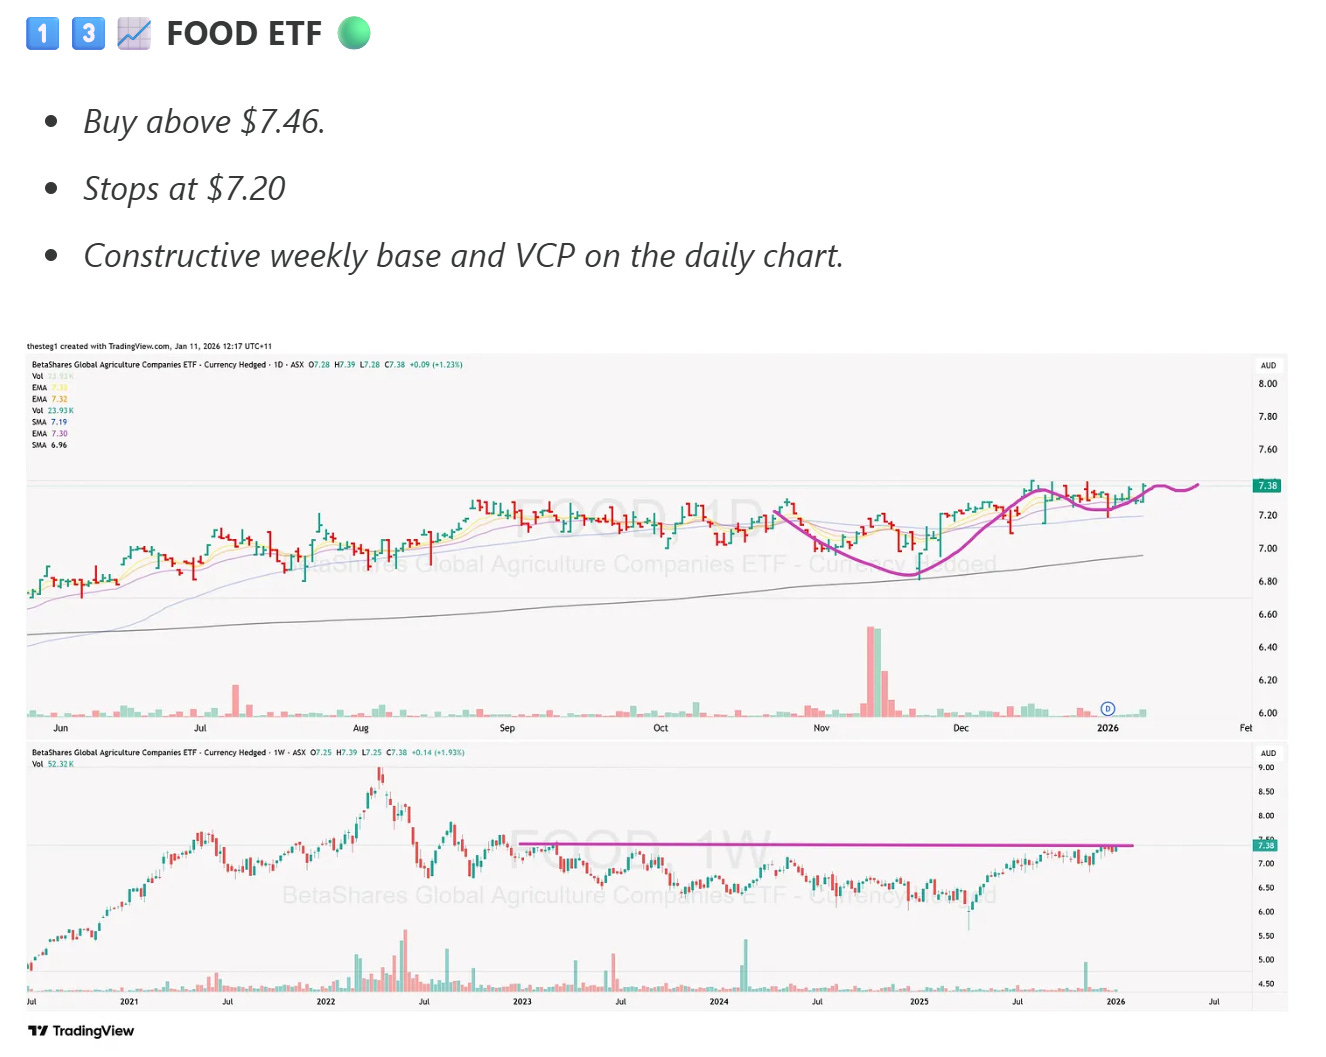
The key buy point is your optimal entry window — it maximizes upside potential while allowing a tight, quantifiable stop-loss area (typically no more than 8% below the buy point, as detailed in the Stop Losses Explained section).
Once the price reaches or approaches the key buy point and the thesis remains intact, that’s when we consider executing (or scaling in). Trade alerts provide the exact rationale, levels, and any sizing guidance so you can act in near real-time with confidence.
Why these levels matter so much:
A disciplined entry from the key buy point gives your position the widest possible “buffer” — room between entry and stop — before risking meaningful capital. This lets winners run without unnecessary shake-outs and keeps losses small and cheap if the idea doesn’t play out. Entering too far above the buy point shrinks this buffer, increases effective risk, and turns a high-edge setup into a mediocre or poor one.
Quick rule of thumb for entries above the key buy point:
- Ideal: Enter at or very near the defined buy point.
- Acceptable: Up to 2.5% above if momentum is strong and the setup is still valid (e.g., continuation higher without pulling back). This preserves most of the original risk/reward while accounting for minor slippage.
- Avoid: Anything more than 2.5% above — the buffer compresses too much, stop-outs become more likely on normal volatility, and you’re effectively paying up for less edge. Better to wait for the next setup or a pullback than chase and compromise discipline.
Bottom line: Patience at entry is one of the biggest edges in satellite investing. Follow the alerts, respect the defined levels, and prioritize setups where downside is tightly controlled from the start. This approach — thoughtful entries + quick cuts on losers + letting winners compound — is how we aim to outperform over time while protecting capital.

Q: How do I get alerted for trades you make in the model portfolios?
A: Trade alerts keep you in sync with real-time actions in the Best Ideas Satellite Model Portfolio & Income Model Portfolio — where I put my own money to work testing high-conviction ideas.
Here’s how it works step by step:
- Weekly Setup (Sundays): The comprehensive weekly email (delivered Sundays) outlines the key ideas to watch for the week ahead — themes, sectors, or specific ASX-listed ETFs with defined key buy points, rationale, and any initial positioning guidance.
- Monitoring & Trigger: Throughout the week, we monitor price action, market conditions, and volatility. If a key buy point is triggered (or a sell/exit signal hits) and conditions remain favorable (e.g., no major deterioration in the thesis or broader market), we may add, reduce, switch, or exit the position in the model portfolios.
- Execution & Notification: Once the trade is executed in the portfolio, we immediately send a TRADE ALERT notification via Substack. This post confirms exactly what was done:These alerts are concise, actionable, and include performance context (e.g., since-inception returns vs. ASX 200 benchmark).
- The ETF(s) involved (e.g., ticker, name)
- Action (buy/add, sell/reduce, switch)
- Size/impact on allocation
- Updated portfolio exposure (e.g., cash weighting, sector tilt)
- Brief rationale and any new levels to watch
- Where to Access Them:
- Get instant notifications if you enable Substack alerts (bell icon or email settings).
- View the full archive and latest updates here: Model Portfolios — this is the dedicated paid section with all trade posts, switches, reductions/additions, and periodic performance recaps.
Key Notes:
- Alerts are for paid subscribers only (as they include live portfolio actions and my personal trades).
- Trades are opportunistic and tactical — not every key idea triggers an alert every week; we prioritize quality setups and risk management (e.g., raising cash during elevated volatility, as seen in recent examples).
- You don’t need to mirror every trade — use them as signals to inform your own decisions, especially for satellite allocations. Always cross-reference with your risk tolerance, sizing rules, and the FAQs on entries/stops.
This process ensures transparency, timeliness, and discipline: we only act when the edge is clear, and you get notified right away so you can decide whether to follow along.

All charts in the weekly report come from TradingView — same colour scheme and same five moving averages on every chart, so the read is consistent from week to week.
The five MAs:
- 6-day EMA — power-trend tracker. When a leading stock is in a vertical move, it tends to “hug” the 6-day. If a leader is closing on or above the 6-day every day, it’s still in its strongest phase and we let it run.
- 10-day EMA — the leader’s trend line. Power Trend stocks (the strongest momentum names) typically respect the 10-day as their dynamic support. As long as the stock is bouncing off the 10-day on volume, the trade is still working.
- 20-day EMA — short-term trend. The first real pullback level for any healthy uptrend. A tag of the 20-day in a strong stock is usually a buy opportunity. A close below the 20-day on volume is a warning sign — context dependent, but always a trigger to assess.
- 50-day SMA — the line in the sand. Every base, every pullback, every breakout setup is measured against this. The stock must be above the 50-day for a BOwP (Breakout with Pivot) setup, and the 50-day must be above the 200-day. A 50-day violation is significant — we assess whether the stock can reclaim it; if it can’t, we sell.
- 200-day SMA — the big-picture filter. uptrends require price above the 200-day with the 200-day rising. A 200-day violation is major — that’s a full exit signal in most cases. Stocks below the 200-day are in downtrend — short or cash territory.
When all five stack in order (price > 6 > 10 > 20 > 50 > 200) and rise together, we’re in Uptrend. That’s the only environment where we put capital to work. When that stack starts to break down, we tighten stops, take partials, or step aside.
What are moving averages?
A moving average (MA) is a single line laid over a price chart that shows the average price of a stock over a set number of days. It smooths out the daily noise so you can see the underlying trend at a glance.
There are two types we use:
- Simple Moving Average (SMA) — adds up the closing prices over N days and divides by N. Every day in the window counts equally. Best for slow, structural trends.
- Exponential Moving Average (EMA) — does the same job, but gives more weight to recent days. That makes it react faster to new price action. Best for short-term trends where today’s price matters more than three weeks ago.
If price is above an MA and the MA is rising, the trend on that timeframe is up. If price is below an MA and the MA is falling, the trend is down. Where price interacts with the MA (touch, bounce, break) is where the signals come from.

Each ETF I cover in the weekly report is tagged with a coloured circle and a stage label. Together they tell you at a glance what phase the ETF is in and how I’m treating it right now.
The Traffic Light — Green, Orange, Red
- 🟢 Green — Constructive. The setup is either setting up perfectly, working, breaking out, or trending. This is where I want capital allocated.
- 🟠 Orange — On watch. The ETF is either forming a base, close to a decision point, or showing mixed evidence. Not a buy yet, but worth keeping an eye on.
- 🔴 Red — Avoid. The ETF is in a downtrend, breaking down, or in a correction with no signs of a bottom. Capital is better off elsewhere.
The colour is my quick read on whether the ETF deserves attention this week — nothing more, nothing less.
The Stage — Base, Uptrend, Downtrend
The stage tells you where the ETF sits in the base-and-trend cycle:
- Uptrend — Price is making higher highs and higher lows, moving averages stacked in the right order (20 above 50, 50 above 200), and the ETF has broken out of its base. This is where the money is made.
- Base — Price is moving sideways after either a correction or an extended run. The ETF is digesting supply. Bases are where the next trend gets built, but they don’t reward you until they break.
- Downtrend — Price is making lower highs and lower lows. Moving averages unstacking, pointing down. Momentum is against you — don’t fight it.
How to Use Them Together
The two labels combine to give you a fast read on any ETF in the report:
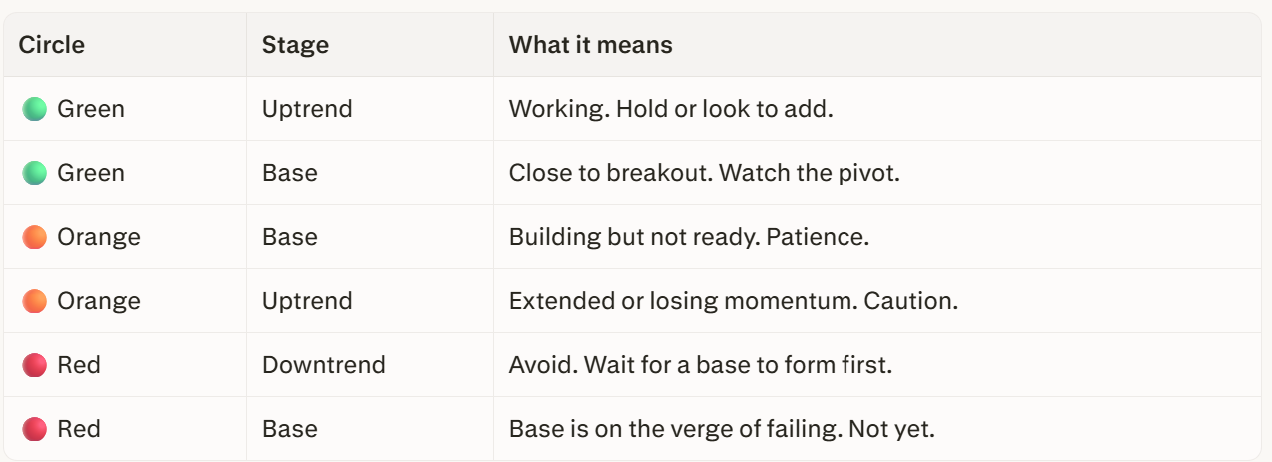
The goal of the system is to keep the language simple and consistent. Every ETF gets the same read, every week, so you can scan the report in seconds and know where I stand on each name.

Here is a video series I did explaining how I think about investing ⤵️
ETFs vs Shares
- How ETFs provide instant diversification
- Why ETFs open doors to global opportunities (AI, robotics, green energy, and more)
- The trade-offs between direct shares and ETFs — and how I use both in real portfolios
Why Use Charts
- See how charts reveal real investor behaviour
- Spot repeating patterns to gain an edge
- Combine fundamentals and technicals for smarter ETF decisions
The Base & Trend Model
- Learn how stocks and ETFs move through base → trend cycles
- Spot breakouts early to tilt the odds in your favour
- Use real-world examples to see where money is really flowing
Volatility Contraction Pattern
- Master the Volatility Contraction Pattern (VCP) — a proven breakout setup
- See how ETFs like XMET, ACDC, GMTL, and MVR flashed this pattern
- Learn the method Mark Minervini used to turn a small account into millions
Sector & Thematic ETFs
- Target the strongest growth areas with sector & thematic ETFs
- Capture megatrends like AI, clean energy, and cybersecurity
- Go beyond indexes to tilt into the stories shaping the future
Bringing It Altogether (+ bonus offer)
- Invest smarter with ETFs, charts, and market rhythm.
- Spot trends early using base and VCP setups.
- Capture growth in AI, clean energy, and other megatrends
🚀
If you have any further questions please email me at 📩 info@etfadviser.com.au and I will respond and more often than not, add your question to the list.
⚠️Important Disclaimer & General Advice Warning⚠️
This publication and subscription service provide general information and research on ASX-listed ETFs, market trends, and investment ideas. It is not personalised financial advice and does not take into account your personal objectives, financial situation, or needs.
At this price point, the content is designed as a research and educational resource for informed, self-directed investors. Each week, we share our researched ASX-listed ETF ideas—including key entry/exit levels and implementation guidance via model portfolios—but given we have no understanding of your personal circumstances, this is not an express recommendation to buy, sell, or hold any investment.
Always read this in conjunction with other trusted research sources, conduct your own due diligence, and consider seeking independent professional advice before making any investment decisions. Past performance is not indicative of future results, and all investing involves risk, including the potential loss of capital.
Invest wisely.