Australian ETF - Weekly Review (30 August 2026)


A short term top for precious metals and resources; Aussie financials in a dangerous spot; We wait patiently for the next move in markets.

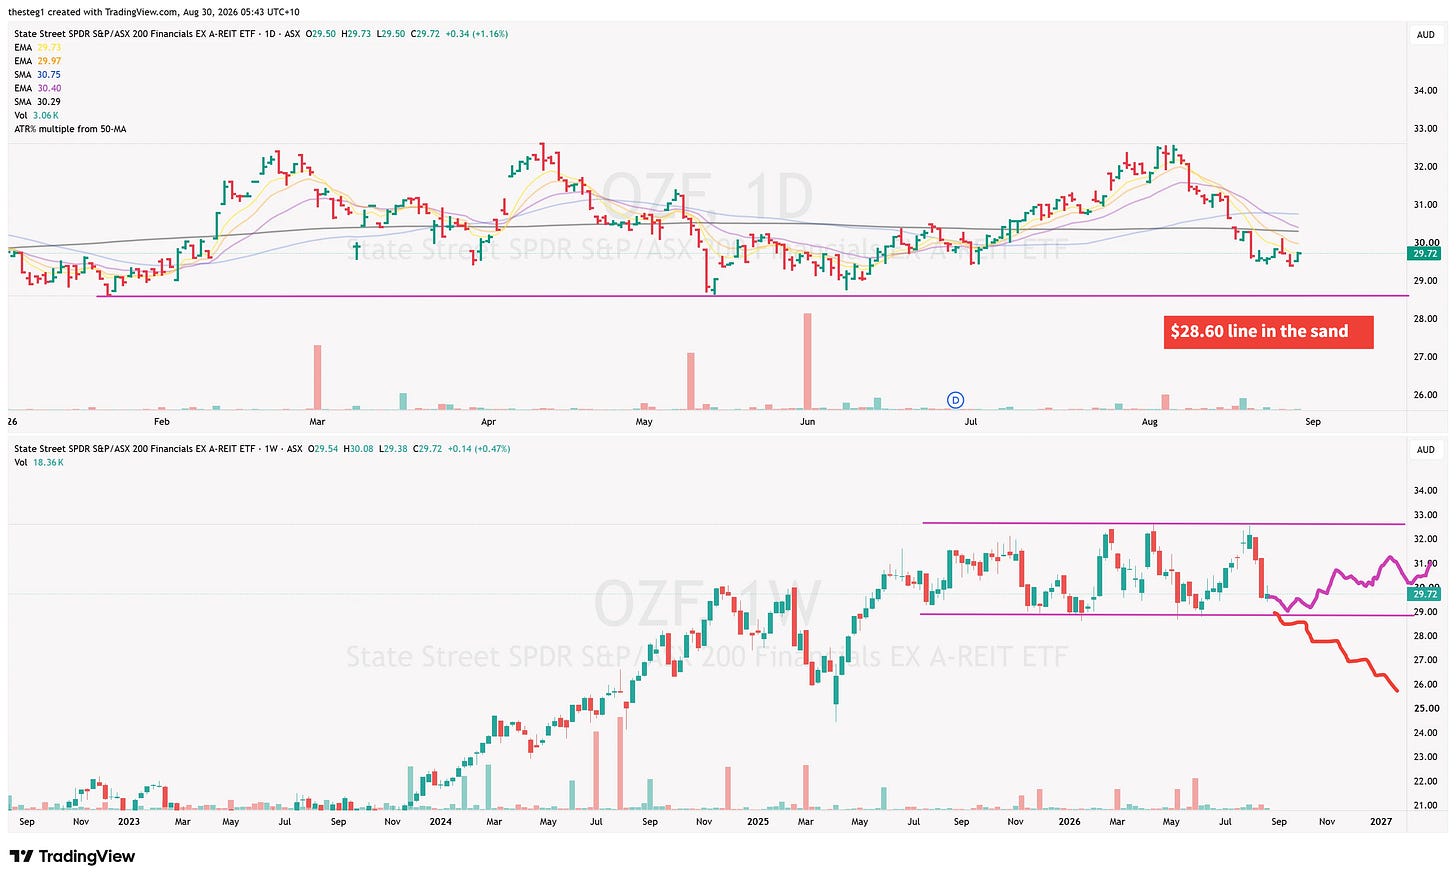
➡️Financials on the Edge
- Aussie banks and property stocks are looking very weak here.
- We have a line in the sand for OZF here, and if that breaks expect a significant pullback.
- This has huge implications for the Aussie index, and dividend focused investors.
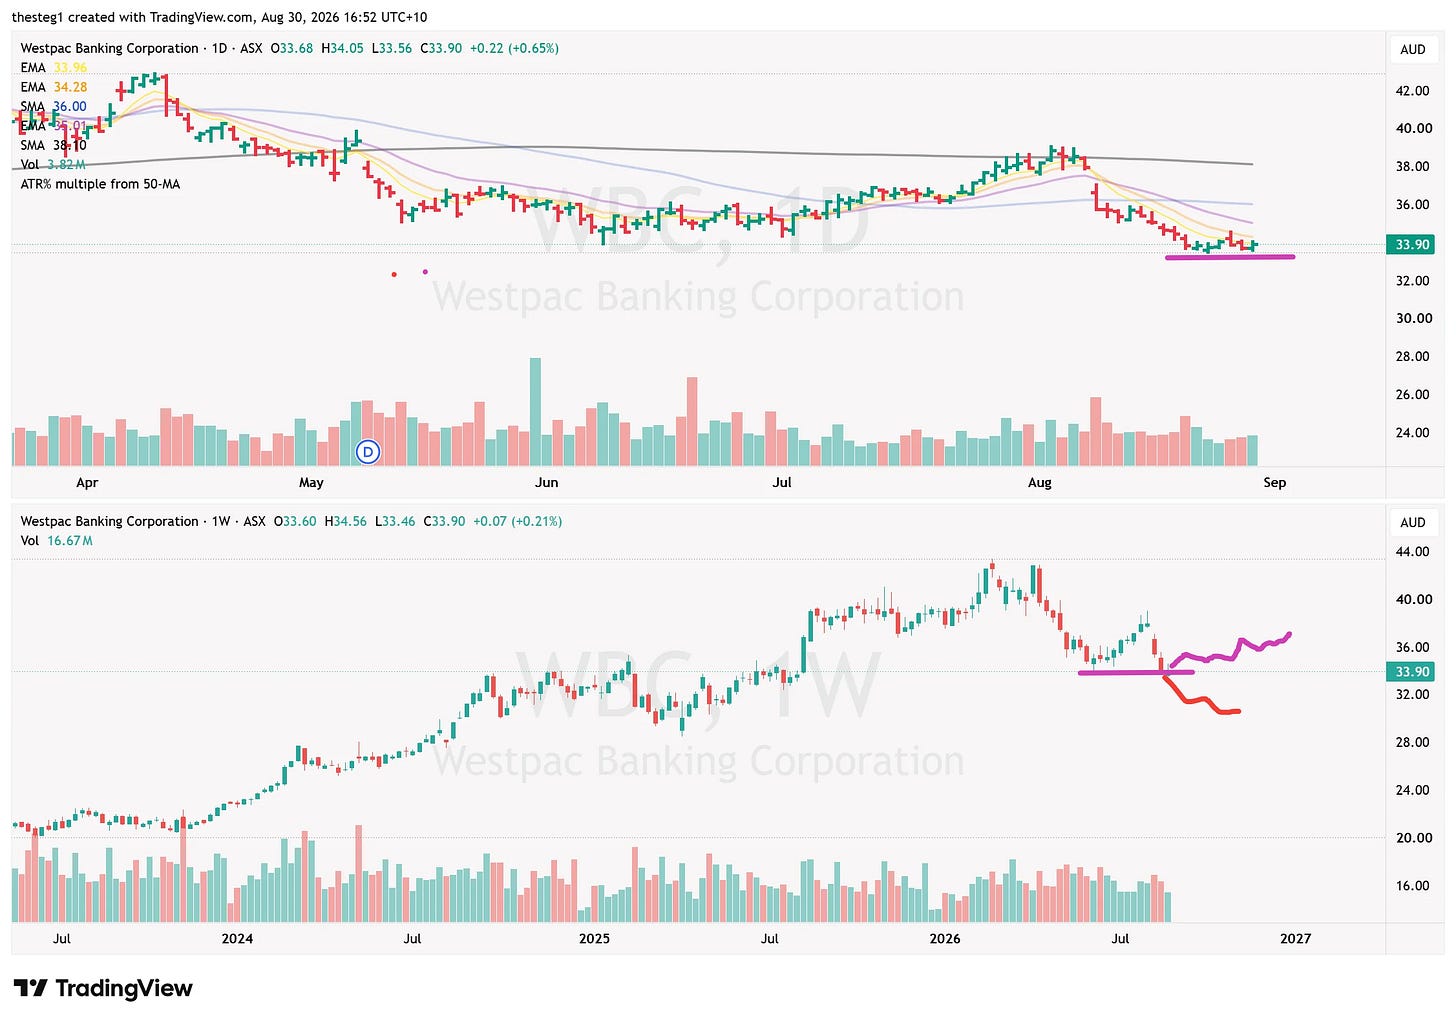
➡️WBC
- Westpac is looking the weakest of the banks.
- If this low breaks then it could lead the other financials lower.

Here is what we cover each and every week:
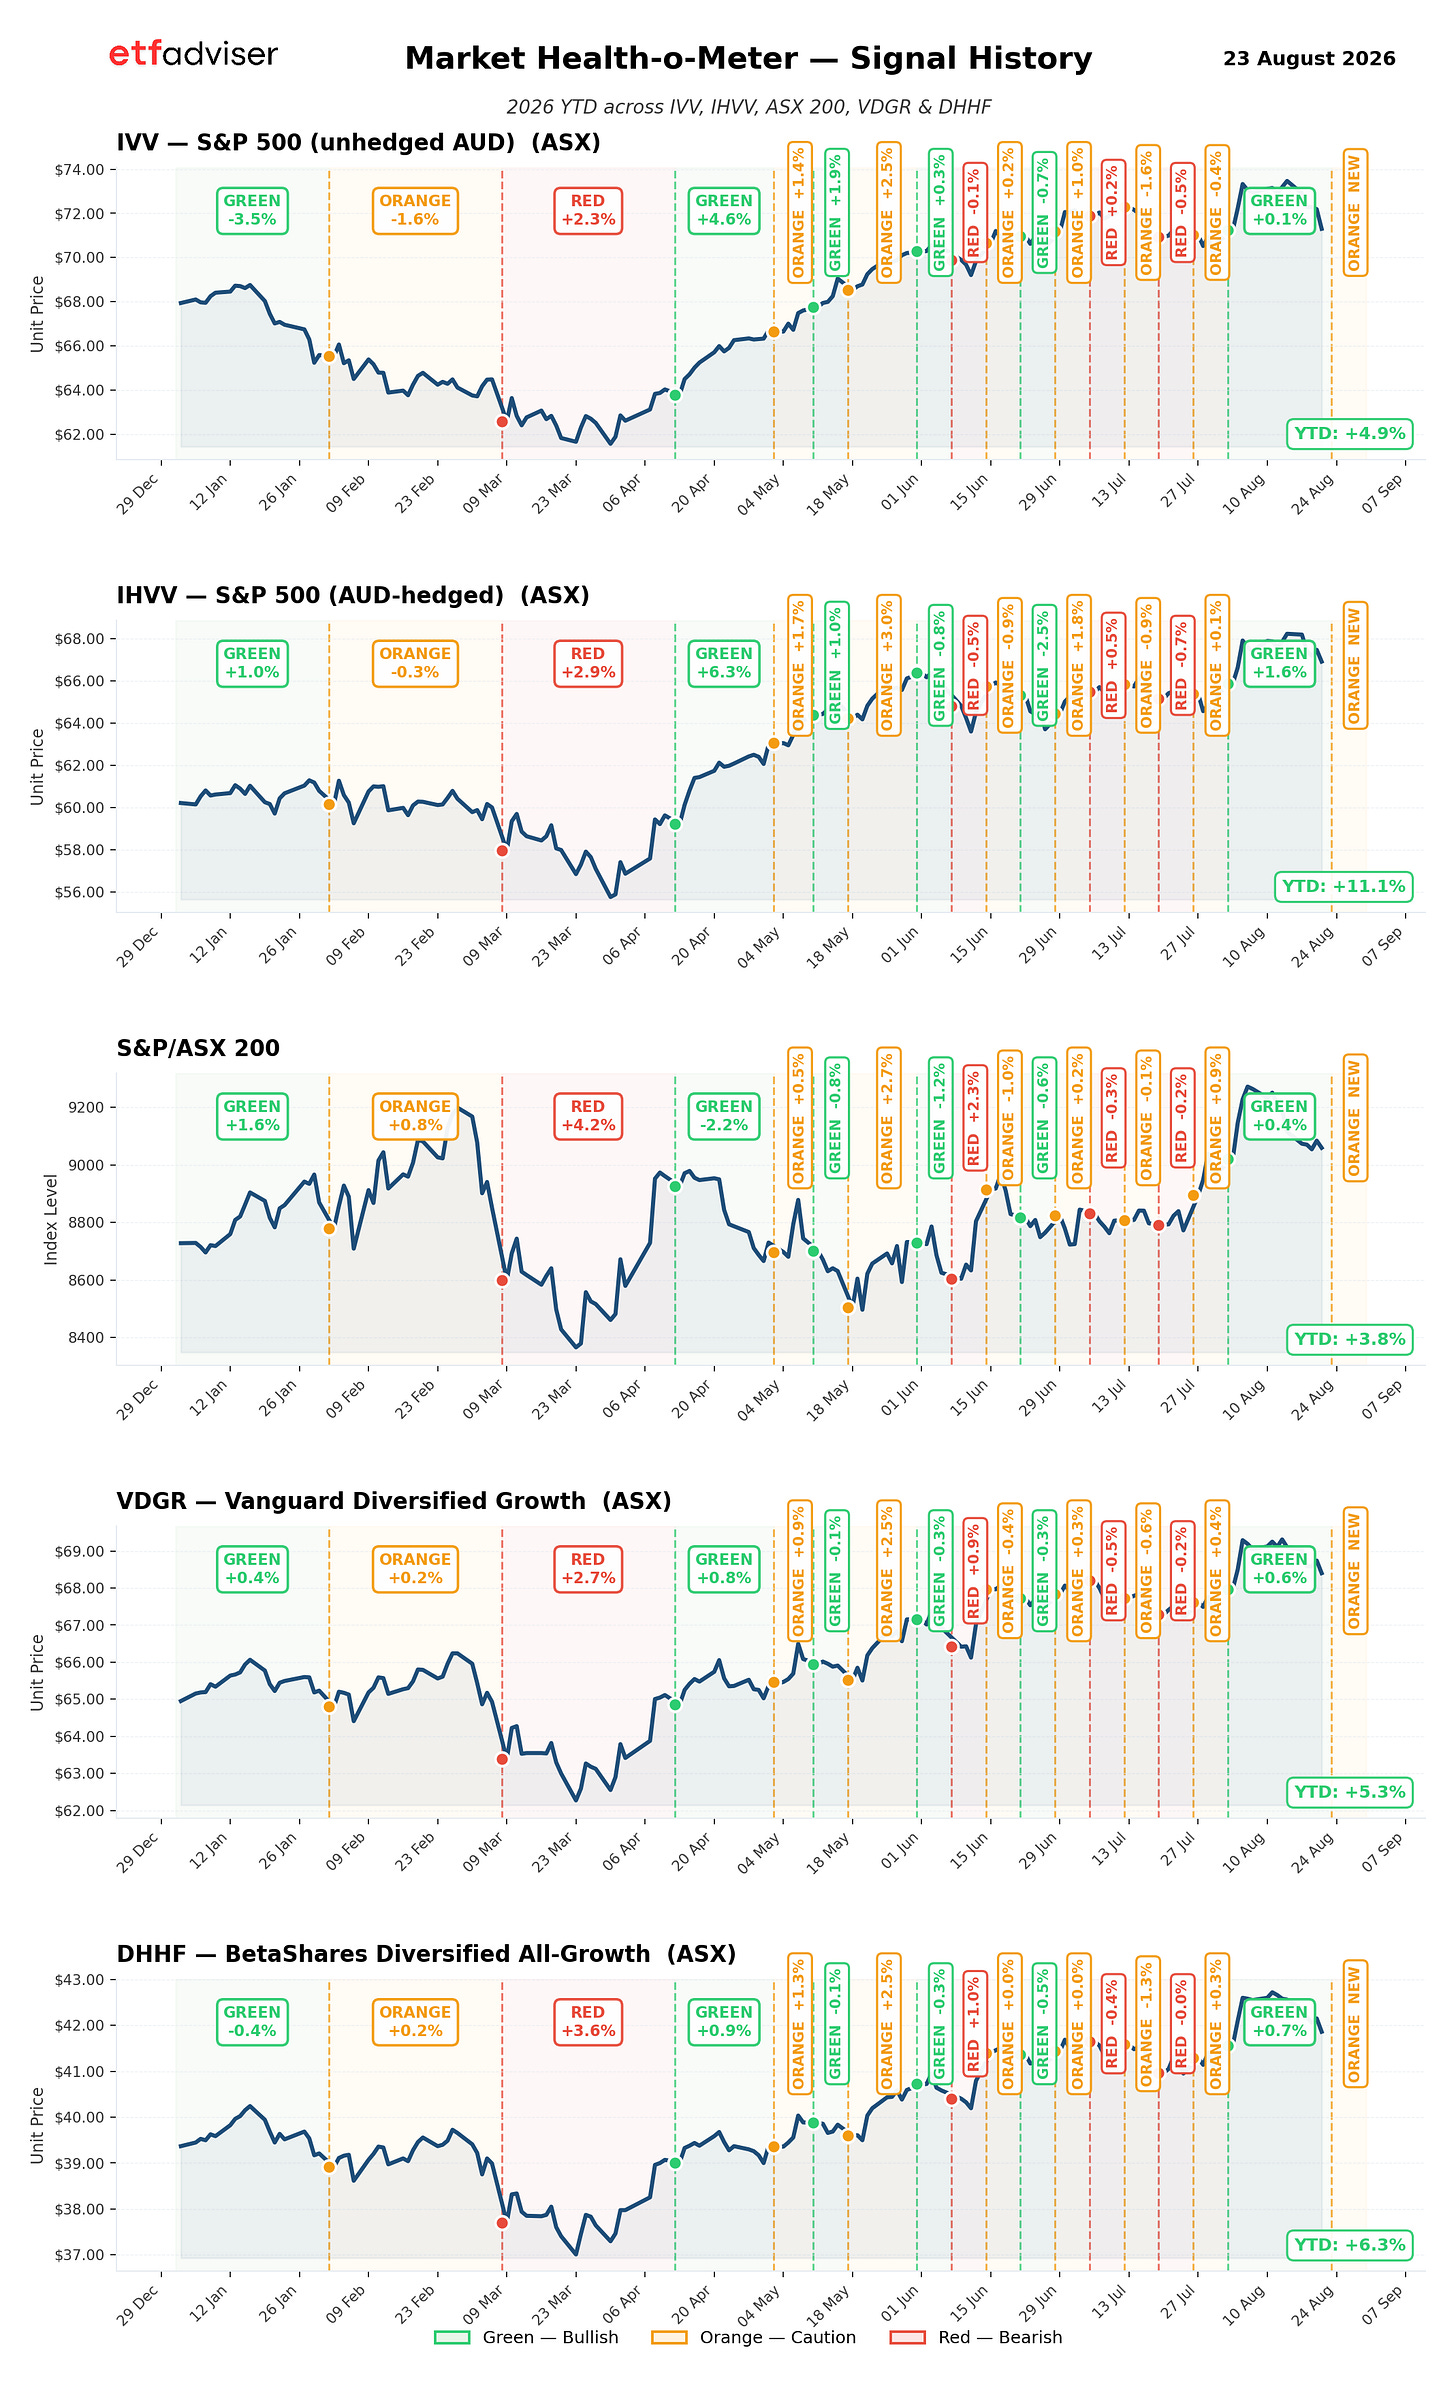
- Market Health-o-Meter
- The signal let’s us know if it is a good time to invest or not.
- US ETF Risk On / Off Measure
- This secondary signal provides further confirmation.
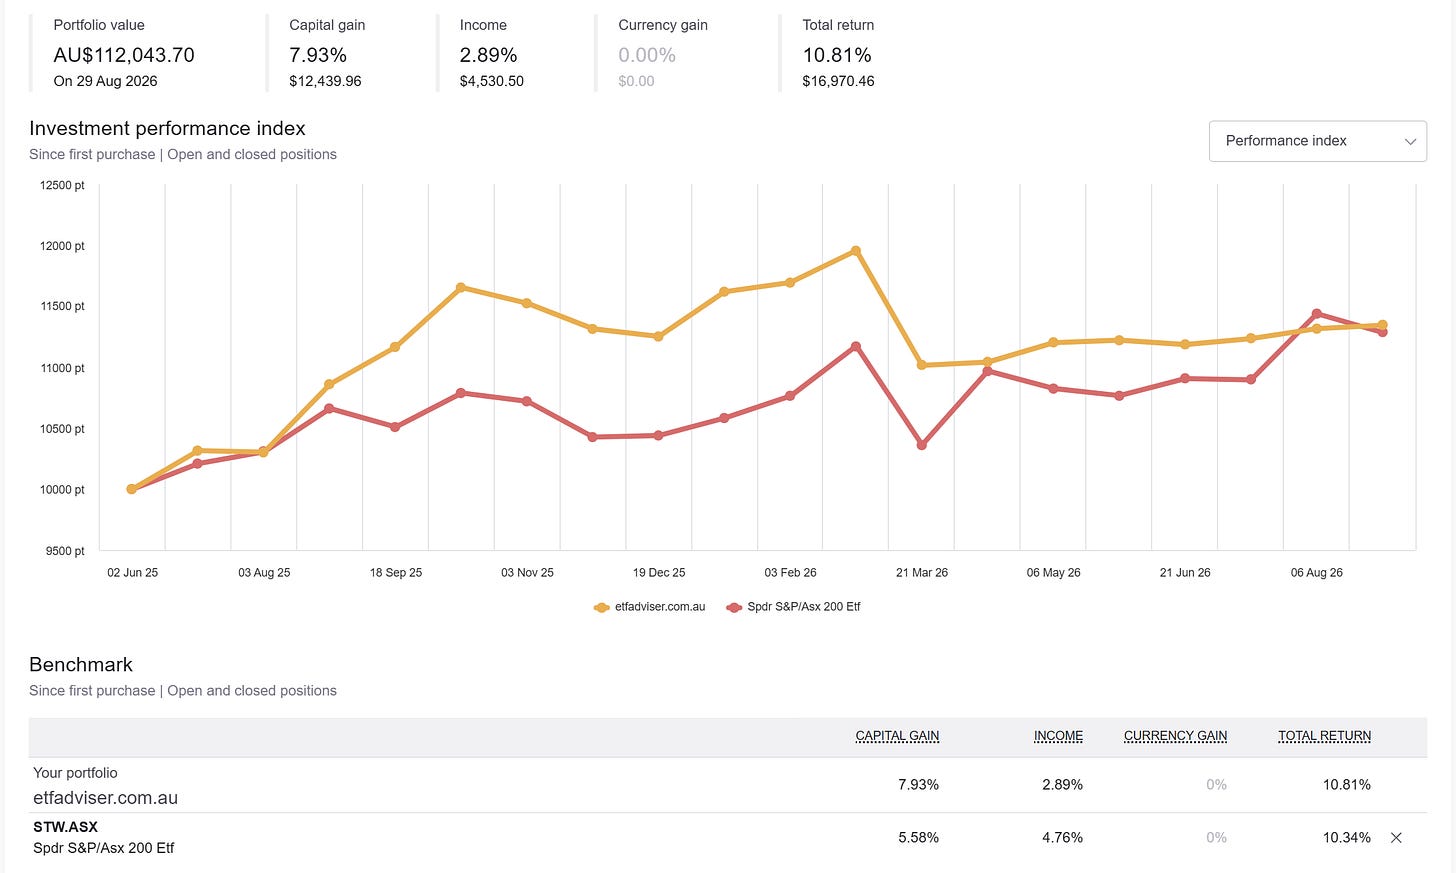
- Best Ideas Satellite Performance
- We put our best ideas to the test.
- Key Ideas Count
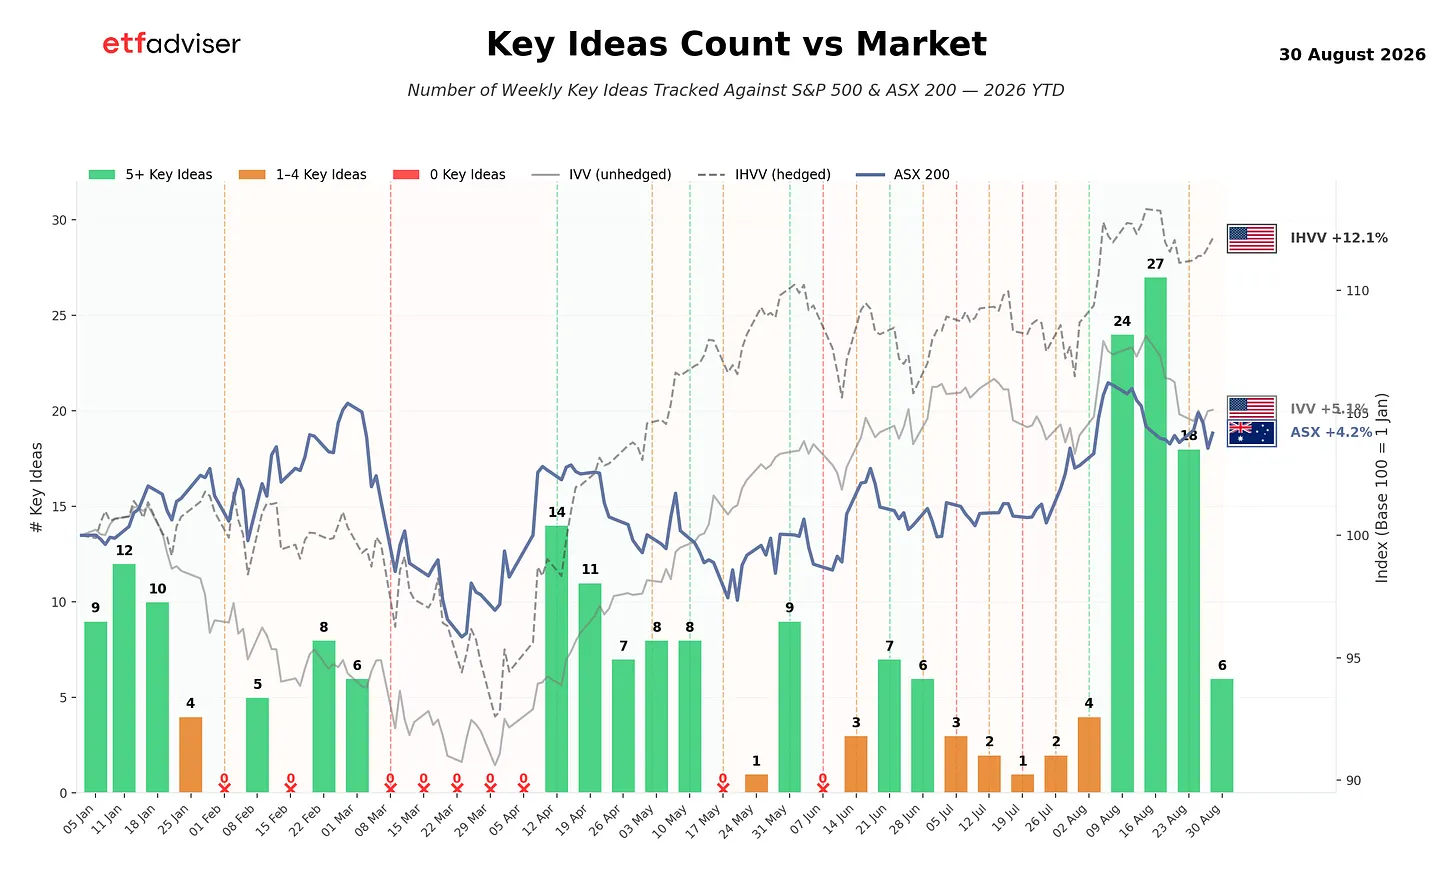
- More ideas usually means better markets.
- Paid Subscribers Actionable Summary
- Our concise summary for subscribers for the week ahead.
- Key Ideas (Satellite Model Portfolio)
- We show the buy and stop loss triggers.
- Review: Best Ideas Satellite Portfolio Review
- Our trades, and our plan for the week ahead.
- ETF Movers
- Weekly
- Monthly
- ETF Asset Class Review
- Cash
- Currency
- Core ETFs
- Income ETFs (including income model portfolio)
- Crypto Assets
- Commodity
- Australian Index
- Australian Sector
- Equity Global
- Equity Asia & Emerging Markets
- Global Theme
- Global Tech
- Global Infrastructure
- ETF in Focus

Market Health-o-Meter
Current Reading = 🟠
We track 17 key ETFs covering a broad range of markets and sectors to gauge the health of the markets from an Australian investor perspective.
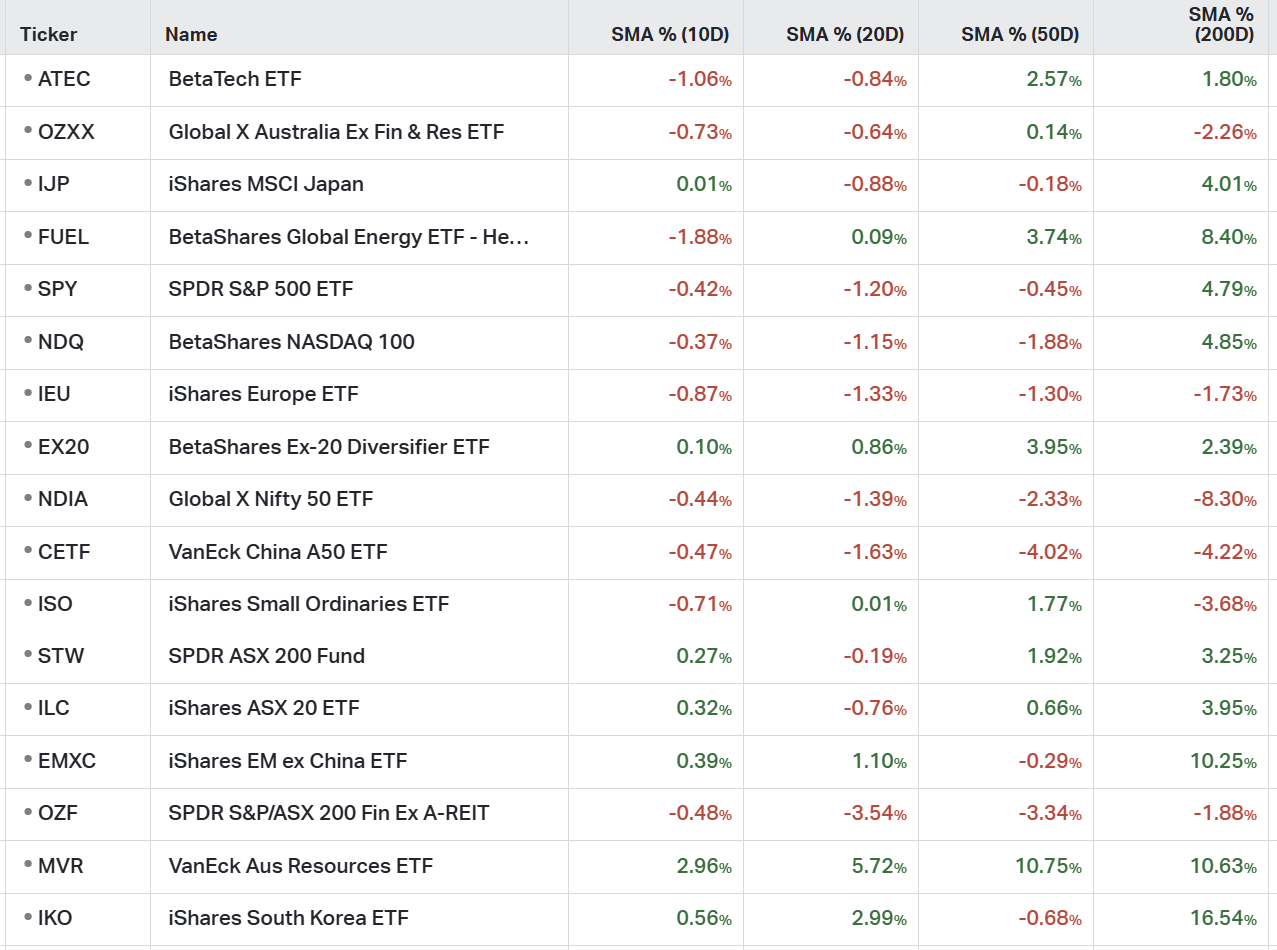
➡️We remain on 🟠 here.
- Above 10 Day Moving Average = 7/17 🔴➡️🟠
- Above 20 Day Moving Average = 6/17 🔴
- Above 50 Day Moving Average = 8/17 🟠
- Above 200 Day Moving Average = 11/17 🟠

Signal History
- Demonstrates the performance of the S&P500, ASX200 and a core portfolio holding (e.g. VDGR) from the period of our signal changes so far in 2026:
- The choppy nature of this signal gives you all the information you need to know about being an Aussie investor at the moment - it has been challenging.

US ETF Risk on / Risk off
Current Reading = 🟠
We track 9 key ETFs listed in the US to gauge risk tolerance.
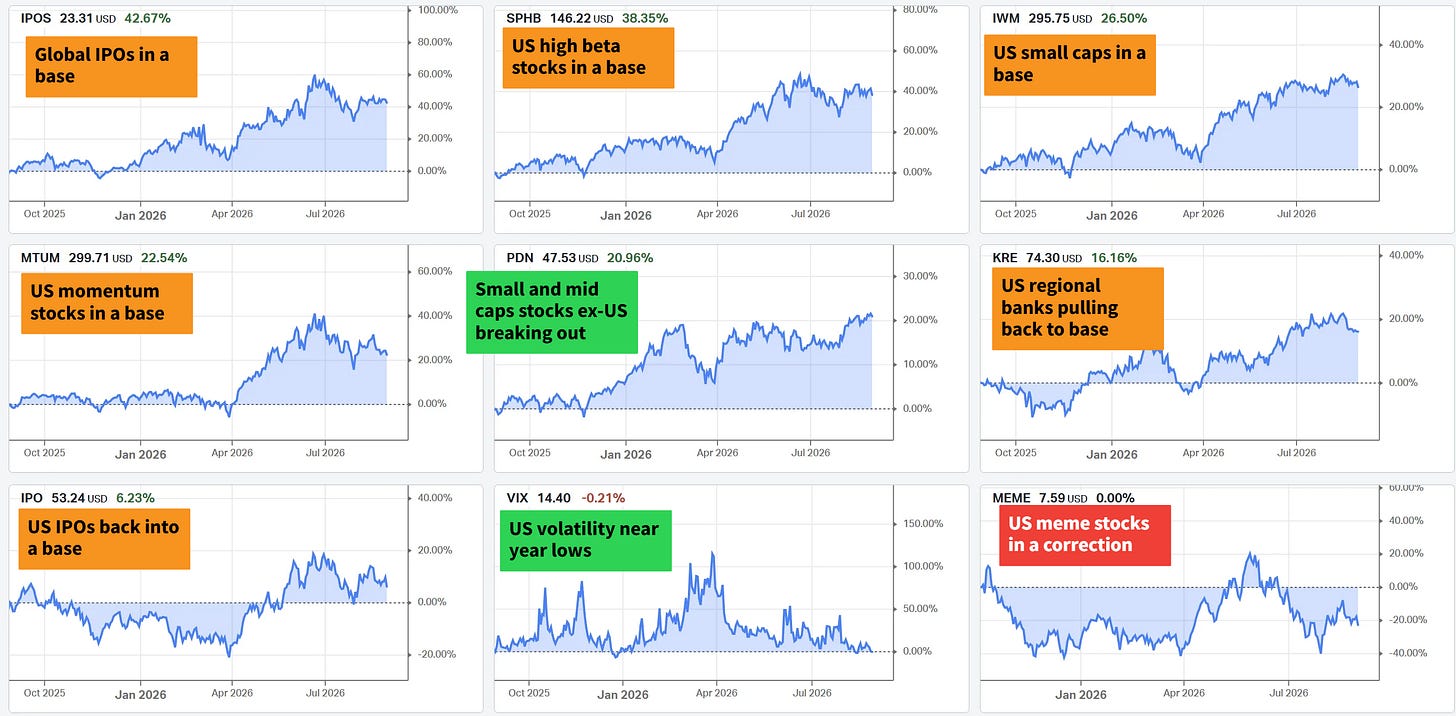
- Most of these are back into bases here.

➡️ Performance since inception 1 June 2025:
- We are biding our time to take on new positions in the coming weeks.
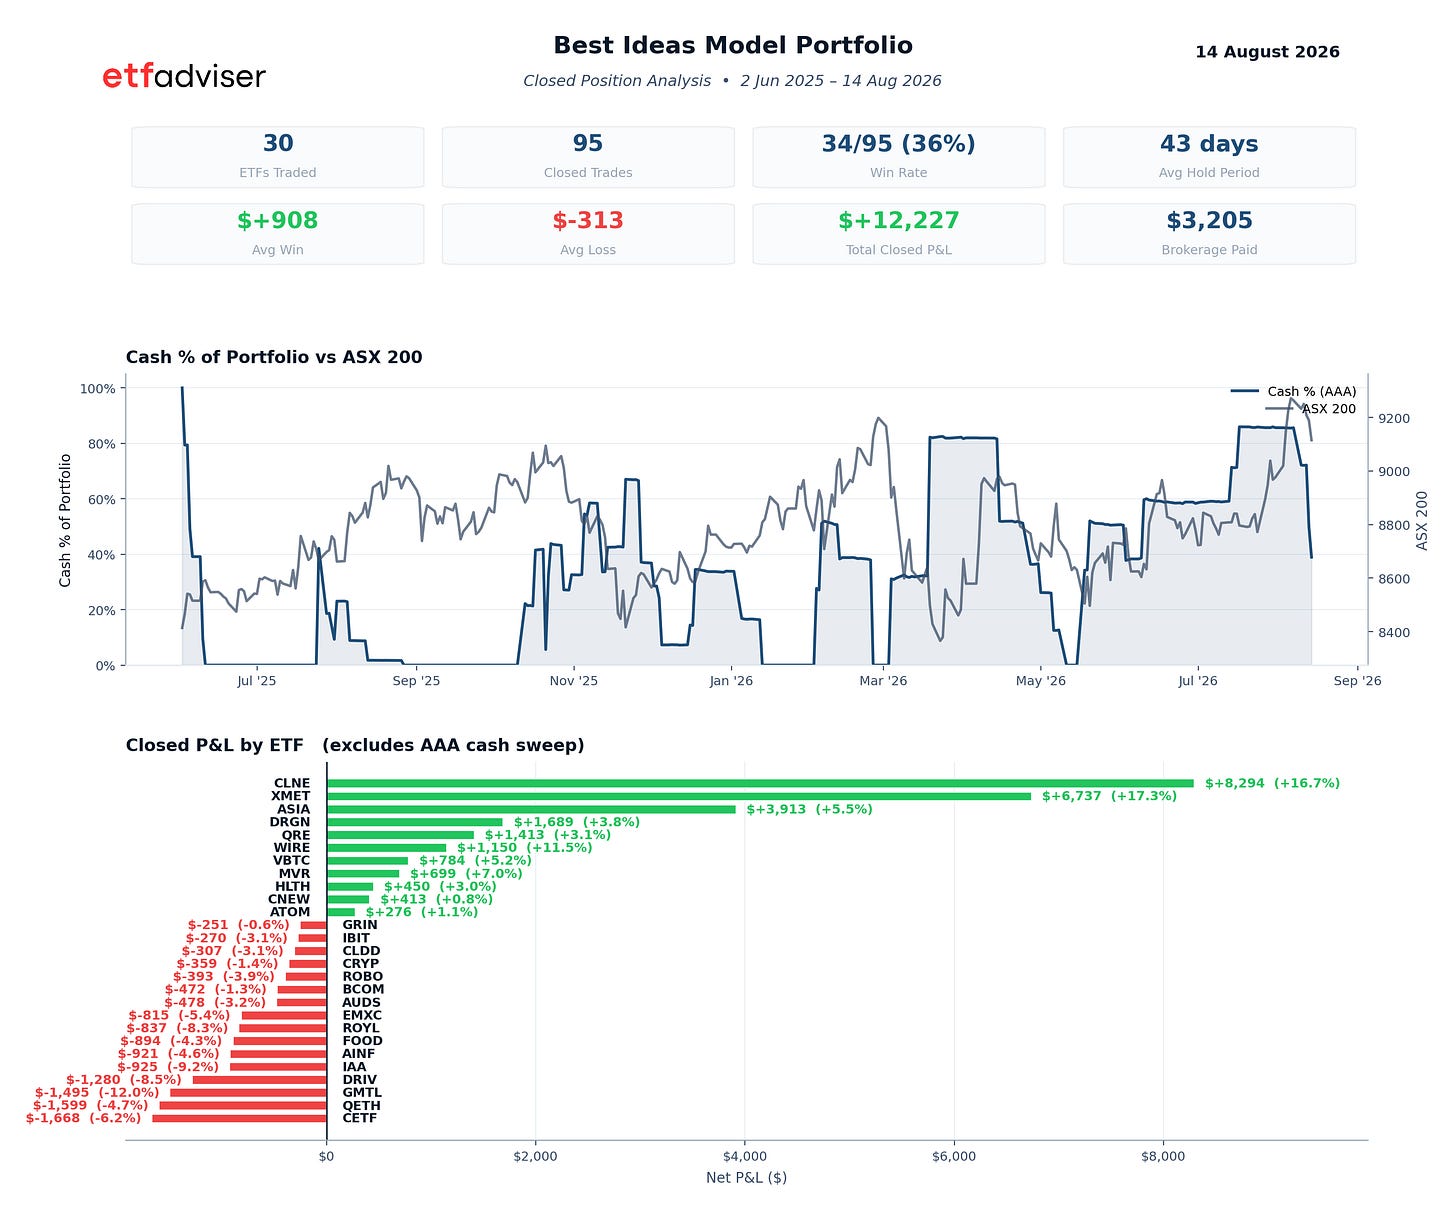
Portfolio Data (14% cash holding)
- We have started to deploy our cash.
- We avoid market corrections by raising cash and protecting our gains:

Key Ideas Count
Here are the number of key ideas we have for the best ideas satellite model portfolio for the week ahead - the stronger the market, the more ideas we will have because the charts will reflect this.