Australian ETF - Weekly Review (13 September 2026)

From here into mid-October is usually a challenging time for markets; We have bond yields and oil prices front and centre for investors to worry about; Most markets look like they need more time.

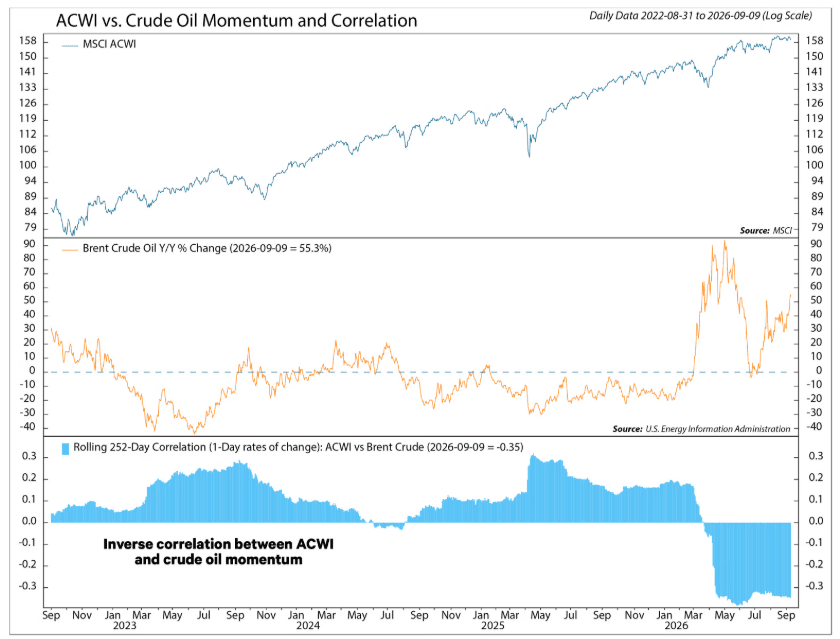
➡️Stocks vs Oil
- For most of the last three years, rising oil prices weren't a major drag on equities.
- That changed following the bombing of Iran, with the correlation between stocks and crude turning negative in March and remaining there since.
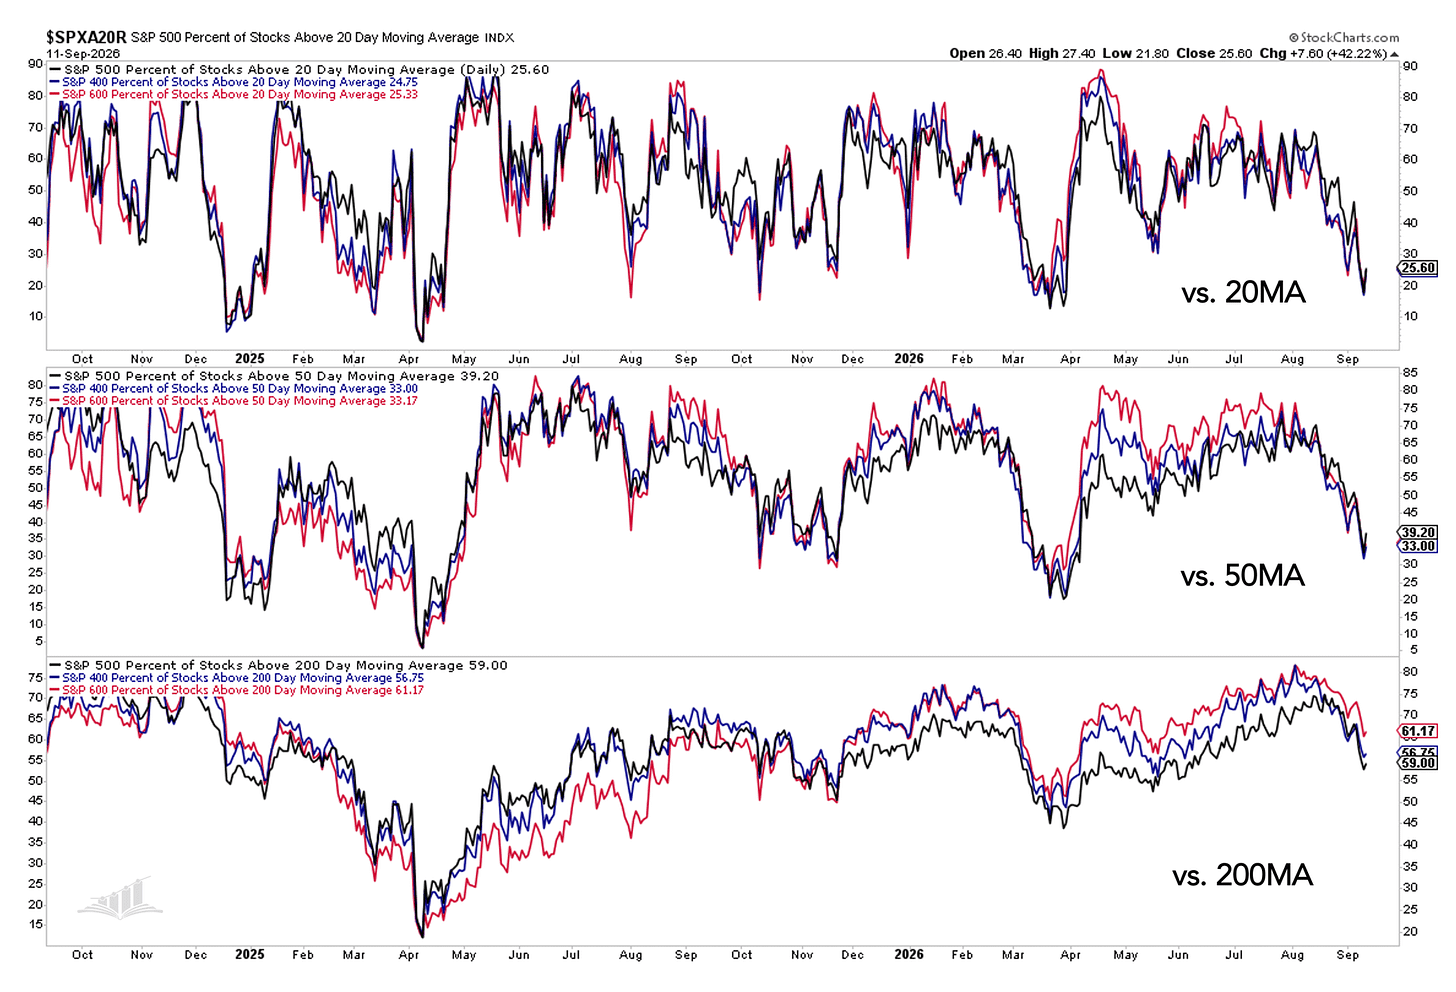
➡️Bad Breadth
- Breadth—as measured by the percentage of stocks trading above key moving averages—has deteriorated sharply over the past month across large (black), mid (blue), and small caps (red).

Here is what we cover each and every week:
- Market Health-o-Meter
- The signal let’s us know if it is a good time to invest or not.
- US ETF Risk On / Off Measure
- This secondary signal provides further confirmation.
- Best Ideas Satellite Performance
- We put our best ideas to the test.
- Key Ideas Count
- More ideas usually means better markets.
- Paid Subscribers Actionable Summary
- Our concise summary for subscribers for the week ahead.
- Key Ideas (Satellite Model Portfolio)
- We show the buy and stop loss triggers.
- Review: Best Ideas Satellite Portfolio Review
- Our trades, and our plan for the week ahead.
- ETF Movers
- Weekly
- Monthly
- ETF Asset Class Review
- Cash
- Currency
- Core ETFs
- Income ETFs (including income model portfolio)
- Crypto Assets
- Commodity
- Australian Index
- Australian Sector
- Equity Global
- Equity Asia & Emerging Markets
- Global Theme
- Global Tech
- Global Infrastructure
- ETF in Focus

Market Health-o-Meter
Current Reading = 🟠➡️🔴
We track 17 key ETFs covering a broad range of markets and sectors to gauge the health of the markets from an Australian investor perspective.
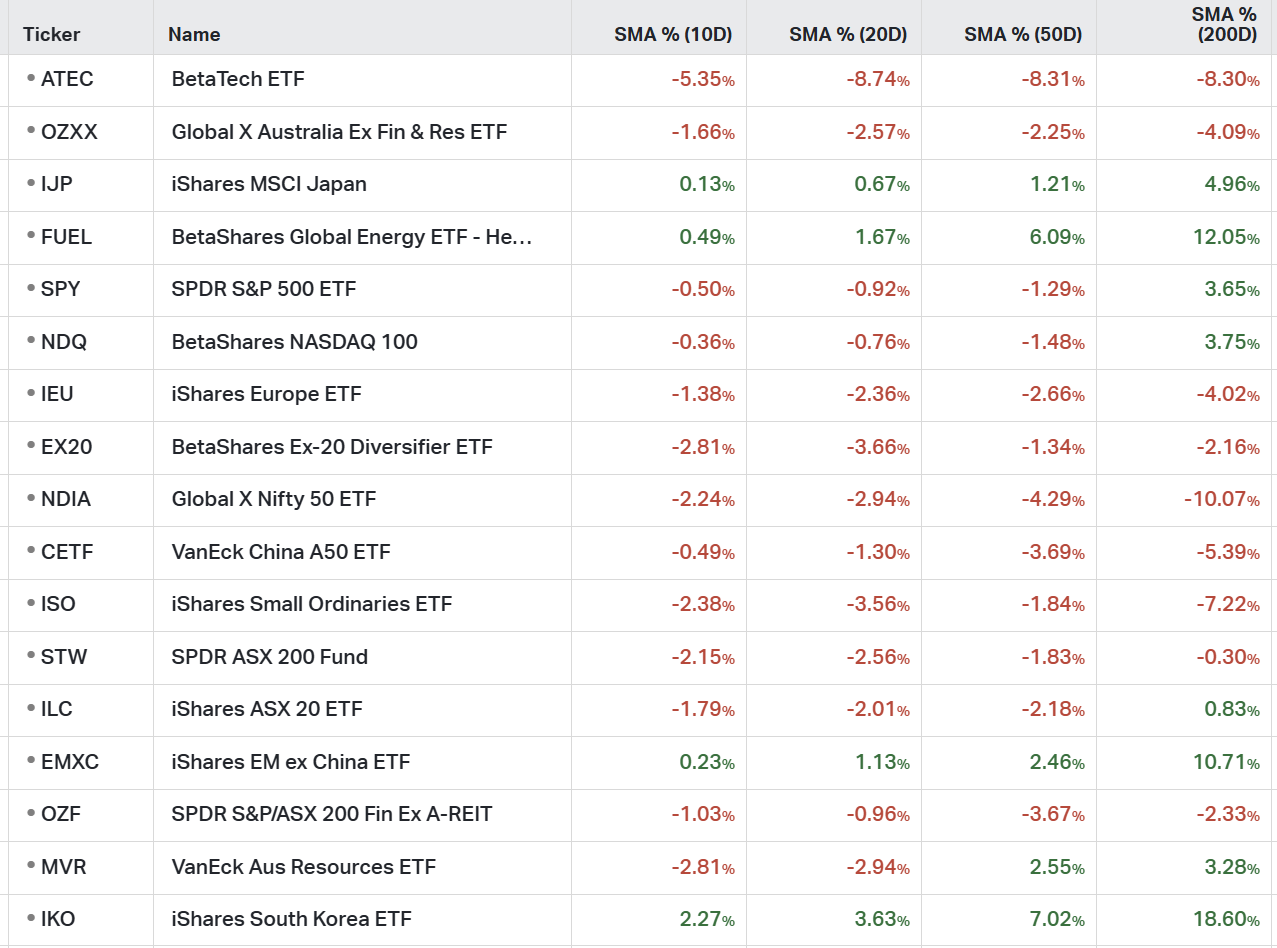
➡️We shift to 🔴 here.
- Above 10 Day Moving Average = 4/17 🟠➡️🔴
- Above 20 Day Moving Average = 4/17 🔴
- Above 50 Day Moving Average = 5/17 🟠➡️🔴
- Above 200 Day Moving Average = 8/17 🟠

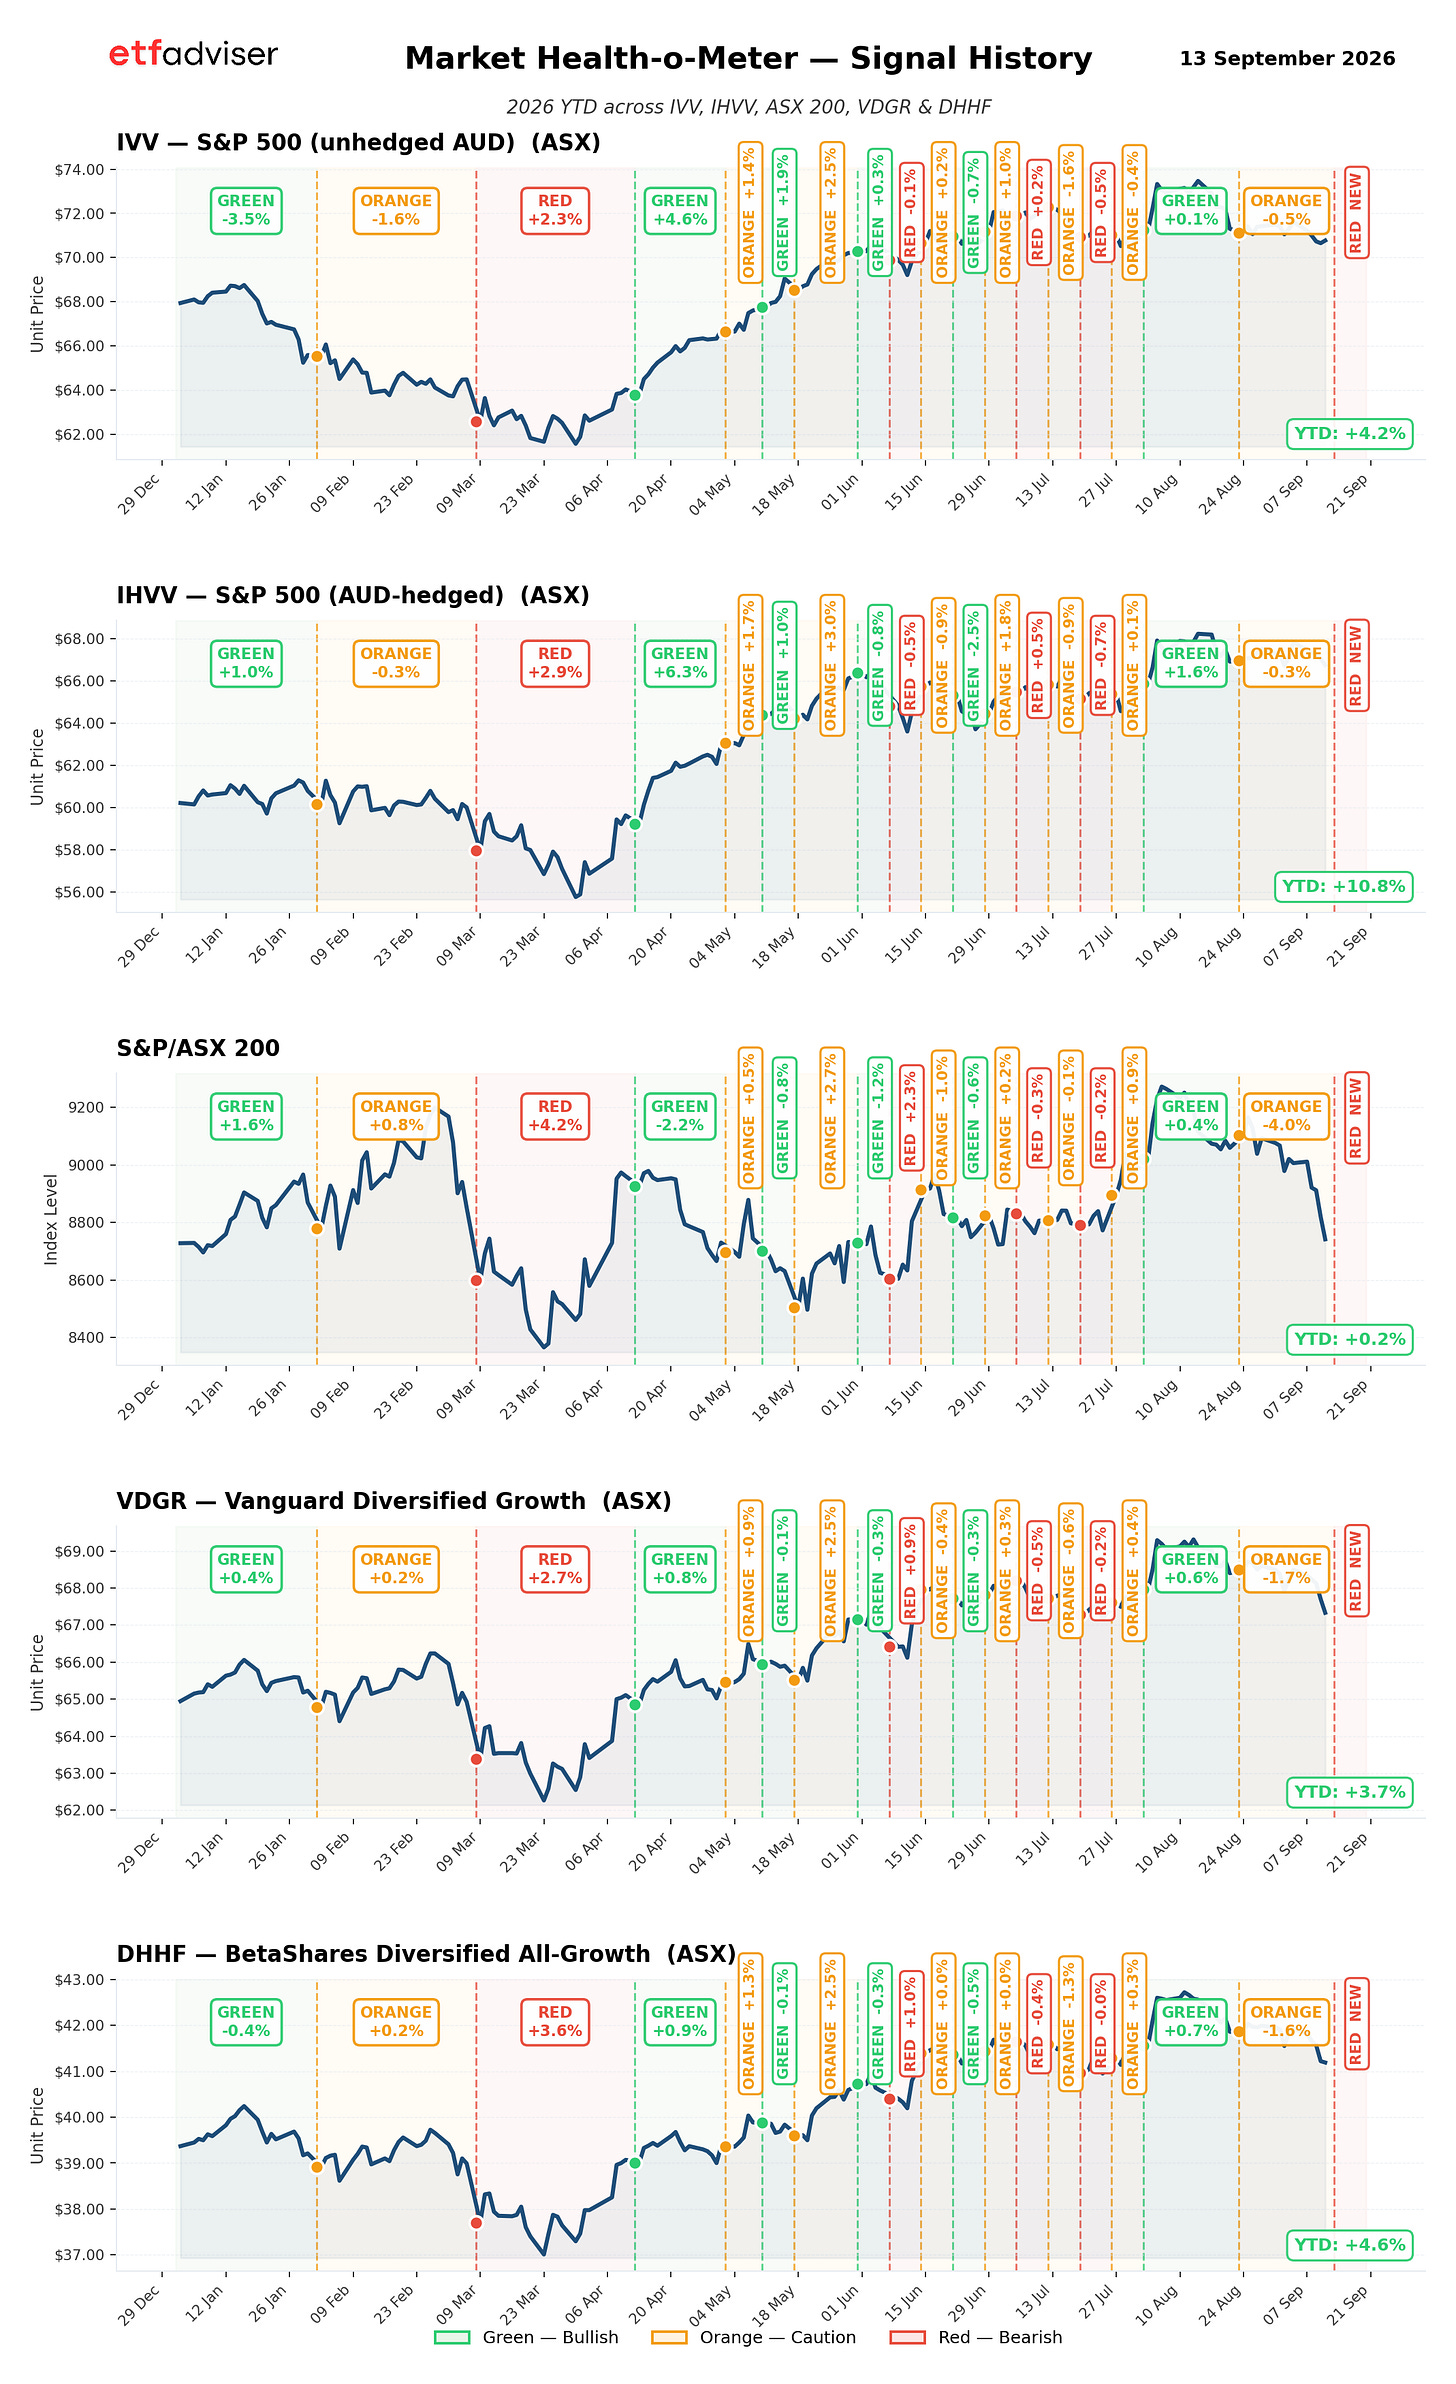
Signal History
- Demonstrates the performance of the S&P500, ASX200 and a core portfolio holding (e.g. VDGR) from the period of our signal changes so far in 2026:
- The choppy nature of this signal gives you all the information you need to know about being an Aussie investor at the moment - it has been challenging.

US ETF Risk on / Risk off
Current Reading = 🟠
We track 9 key ETFs listed in the US to gauge risk tolerance.

- Still 🟠 which is a good sign - despite the market health o meter being on red here

➡️ Performance since inception 1 June 2025:
- We are biding our time to take on new positions in the coming weeks.
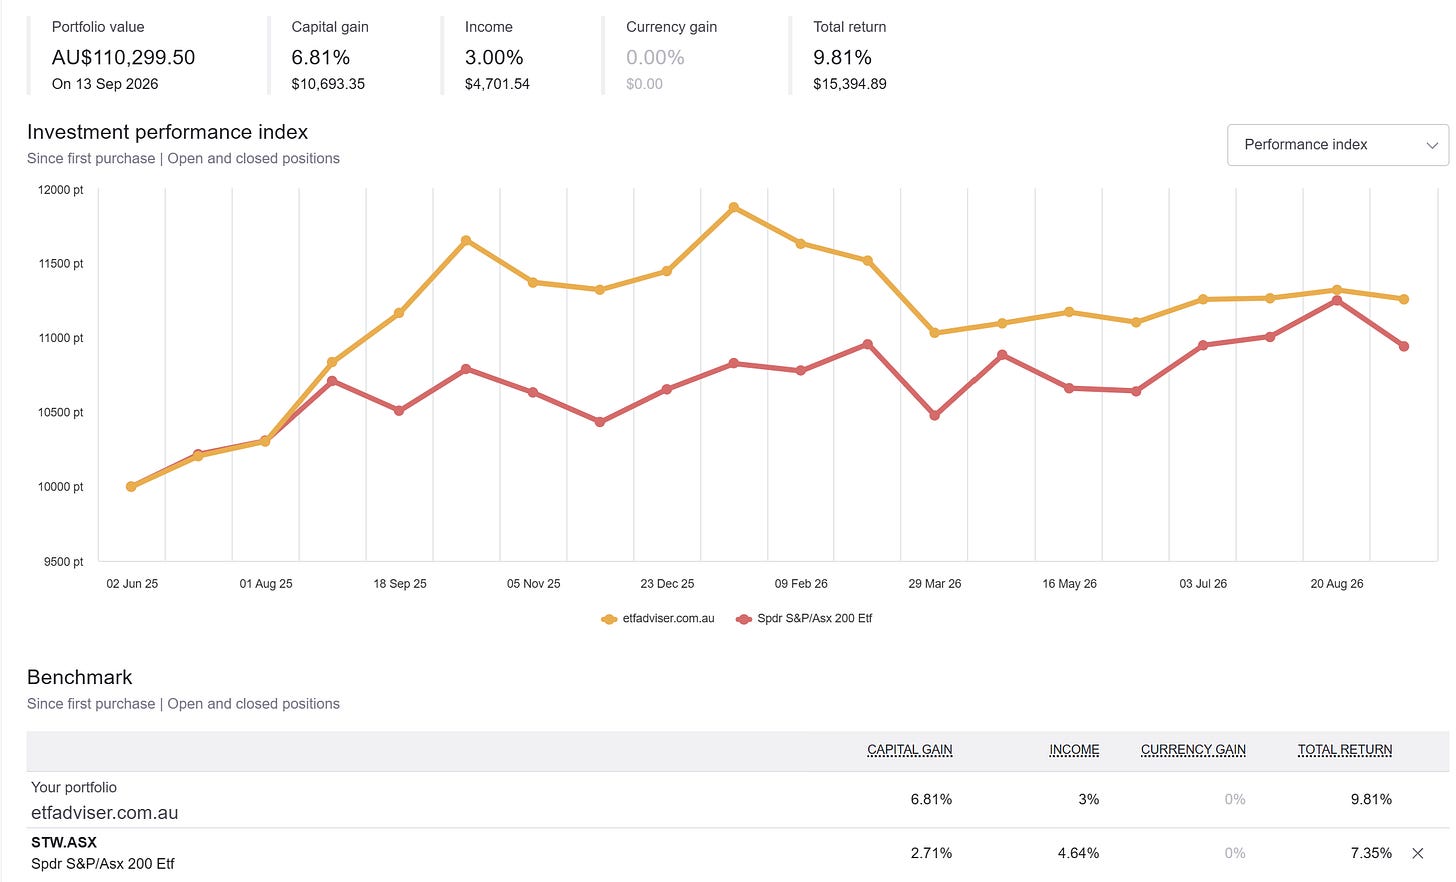
Portfolio Data (44% cash holding)
- We hit some stops, so raised our cash.
- We avoid market corrections by raising cash and protecting our gains:


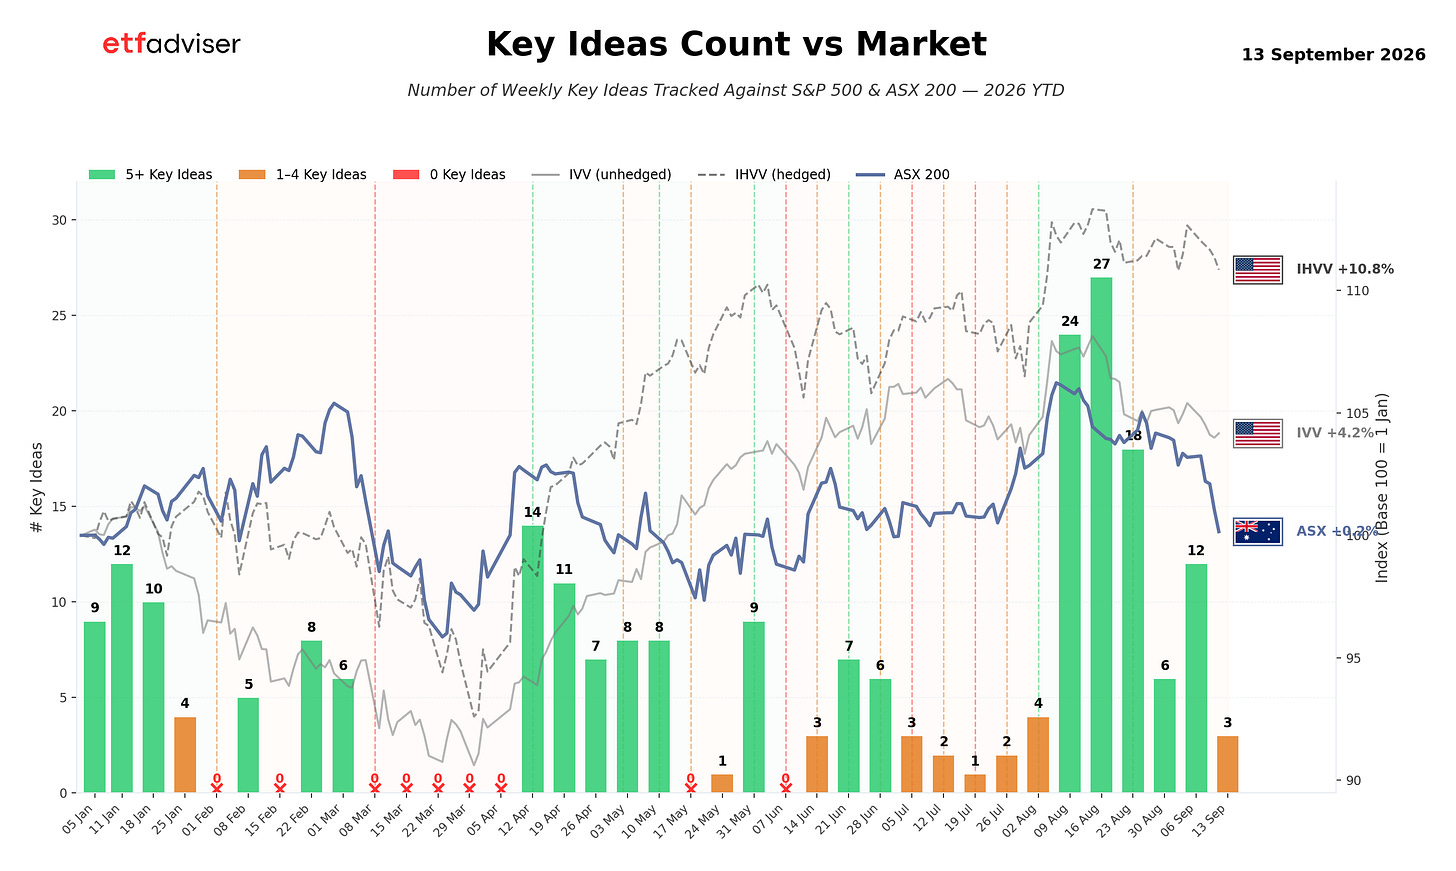
Key Ideas Count
Here are the number of key ideas we have for the best ideas satellite model portfolio for the week ahead - the stronger the market, the more ideas we will have because the charts will reflect this.